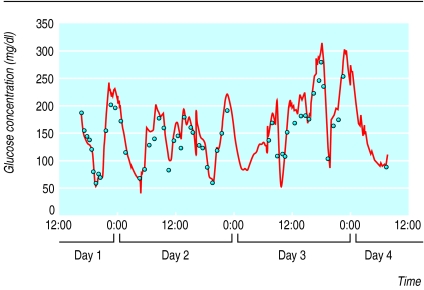
Figure 3.
Continuous glucose recording in a patient with type 1 diabetes by means of microdialysis (black line). Capillary blood glucose concentrations (open triangles) were used for comparison. (Reproduced from Jungheim et al18 with permission of the American Diabetes Association)

