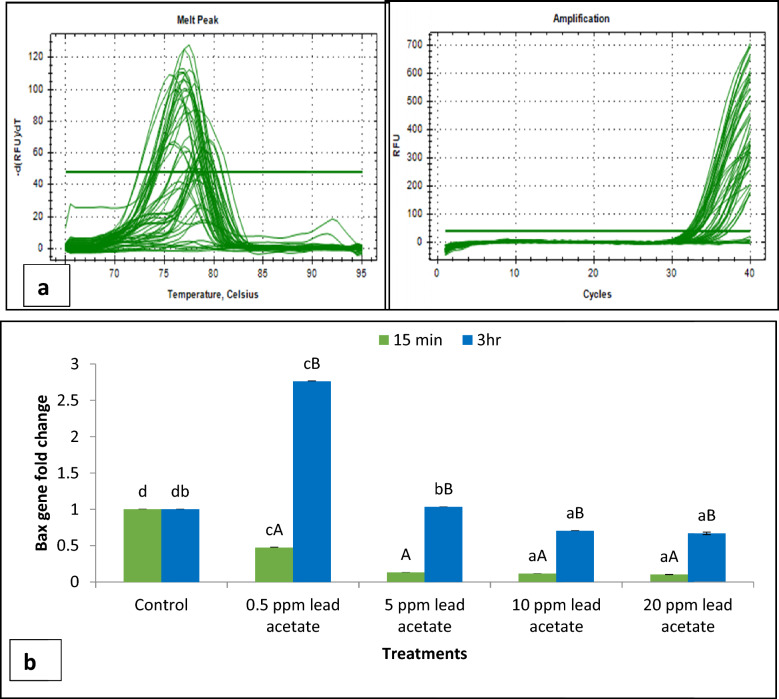
Fig. 16.
a Amplification and melt peak plot of Bax and Beta actin genes in buck spermatozoa treated with different concentrations (0.5, 5, 10 and 20 ppm) of lead acetate after 15 min and 3 h. b Fold change in expression of Bax gene in spermatozoa following in-vitro exposure to different concentrations of lead acetate for different time intervals. Data presented are mean ± SE of the semen samples of six bucks. Different capital superscripts on bars indicate significant (p < 0.05) differences between the different time intervals while small superscripts on bars indicate significant (p < 0.05) differences between different concentration of lead

