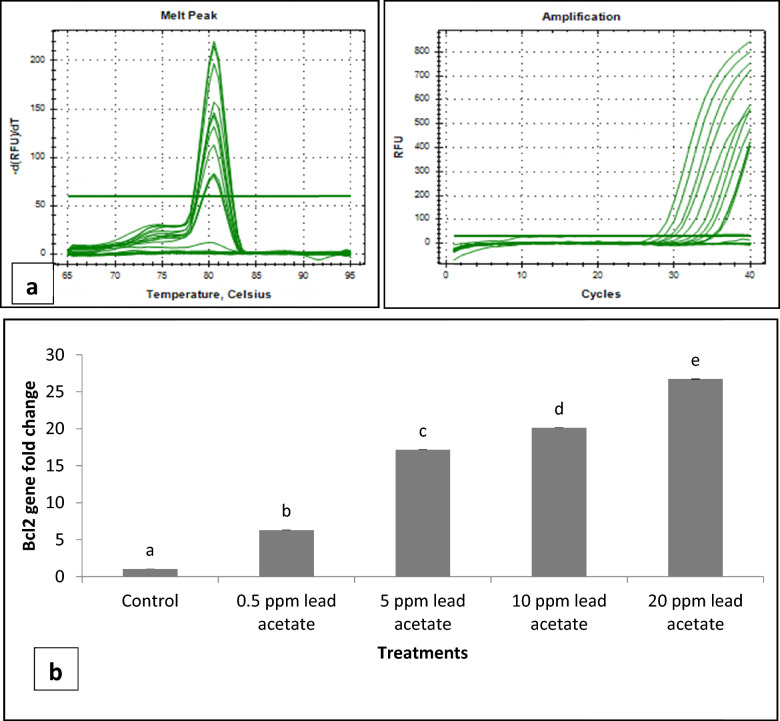
Fig. 17.
a Amplfication and Melt peak plot of Bcl-2 gene in buck spermatozoa treated with different concentrations (0.5, 5, 10 and 20 ppm) of lead acetate after 15 min and 3 h. b Fold change in Bcl-2 gene expression in buck spermatozoa following in-vitro exposure to different concentrations of lead acetate for 15 min. Data presented are mean ± SE of the semen samples of six bucks. Different capital superscripts on bars indicate significant (p < 0.05) differences between the different time intervals while small superscripts on bars indicate significant (p < 0.05) differences between different concentration of lead

