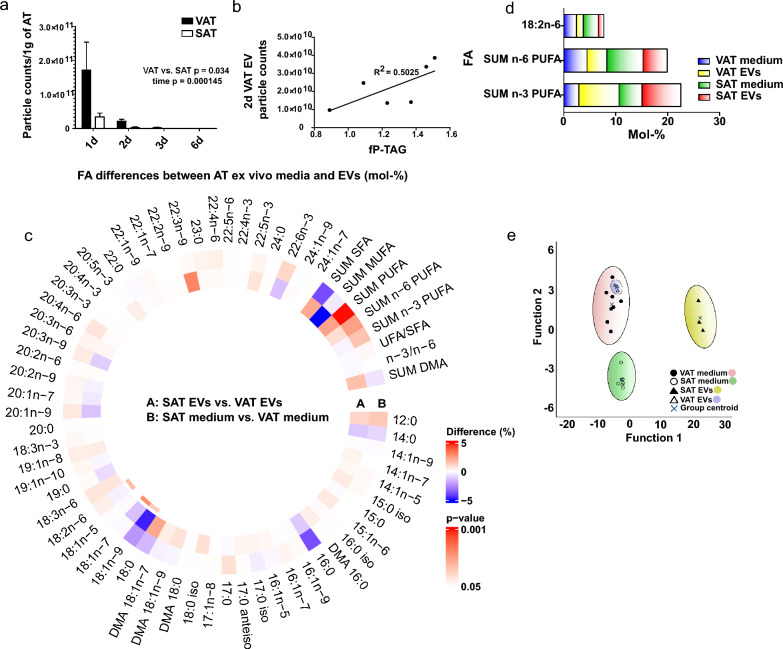
Fig. 4.
Comparison of the extracellular vesicles (EV) from visceral (VAT) and subcutaneous adipose tissue (SAT). Particle counts were obtained by nanoparticle tracking analysis (a). Generalized linear model VAT vs. SAT group p = 0.034, time p = 0.00145. Results include AT cultures of 6 patients, presented as mean + SEM. All EV counts have been normalized to 1 g of AT obtained for culturing. Correlation between 2d VAT EV particle counts with patient fasting plasma triacylglycerol levels (fP-TAG) (b). Spearman’s rank correlation efficient 0.829, p = 0.042. Fatty acid (FA) profiles of VAT and SAT EVs, as well as ex vivo culture media, were determined from total lipids with gas chromatography–mass spectrometry (c). Results are presented as percentage differences, calculated by subtracting the mol-% of each FA in the VAT group from the mol-% in the SAT group. Red indicates an increase in the SAT group, while blue indicates a decrease. FAs are listed in the order of increasing chromatographic retention time. DMA plasmalogen alkenyl chain-derived dimethyl acetal derivative, SFA saturated fatty acid, MUFA monounsaturated fatty acid, PUFA polyunsaturated fatty acid, unsaturated fatty acid (UFA) = MUFA + PUFA. *p ≤ 0.05 Mann–Whitney U test vs. VAT. Percentages of selected FAs in AT EVs and ex vivo culture media, presented as mean mol-% (d). Results of FA profiles were analyzed from 3 EV samples, which each corresponded to a pooled EV sample from 2 different patients. Media samples were obtained from 2 patients’ AT ex vivo cultures. The supervised discriminant analysis depicts the classification of FA signatures of VAT and SAT EVs as well as corresponding ex vivo media based on discriminant Functions 1 and 2 (e). Function 1 on the horizontal axis explained 89.3% of the variance, and Function 2 8.0% of the variance

