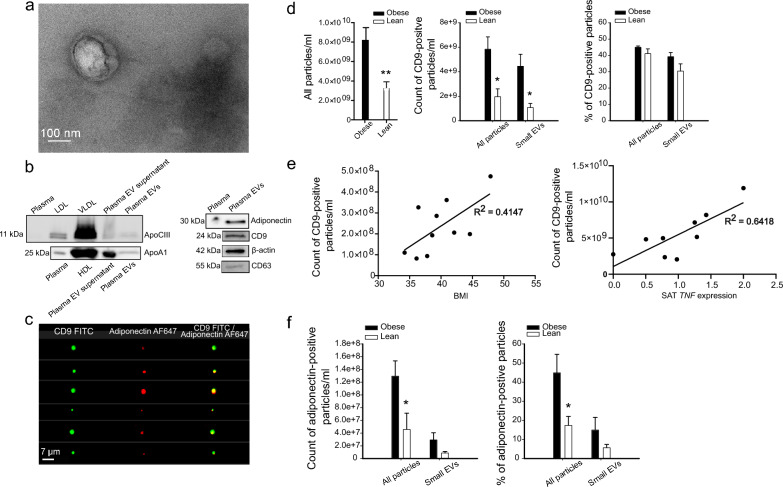
Fig. 6.
Amnis® ImageStream®X Mark II imaging flow cytometry analysis of plasma extracellular vesicles (EVs). Obese: Subjects with obesity, lean: Subjects with normal weight. Sample purity and the morphology of plasma EVs were first analyzed by transmission electron microscopy (a). Scale bar 100 nm. The presence of lipoprotein markers, apolipoprotein A1 (ApoA1) and apolipoprotein C-III (ApoCIII), as well as adiponectin, CD63, CD9, and β-actin EV markers, was analyzed by Western Blotting (b). Plasma EV samples were incubated with the mixture of CD9 and adiponectin antibodies, to test the double-positivity of adiponectin for CD9. Images of double-positive events are shown (c). All particles (objects/ml) and CD9-positive particles were measured, together with the percentage of CD9-positive particles (d) **p = 0.007 and *p = 0.022 (Mann–Whitney U test). Correlation between the number of CD9-positive EV particles with body mass index (BMI) and subcutaneous adipose tissue (SAT) TNF expression (e). CD9 particles and BMI: Spearman’s rank correlation coefficient 0.636, p = 0.048, CD9 particles and SAT TNF expression: Spearman’s rank correlation coefficient 0.733, p = 0.025. Adiponectin-positive particles were counted, and the percentage of adiponectin-positive particles from all particles was measured (f). EV samples from 6 normal-weight subjects and from 10 subjects with obesity were analyzed in total. TNF expression values were obtained from 9 subjects with obesity

