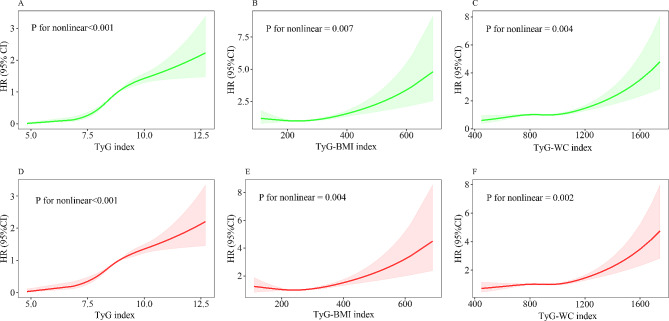
Fig. 1.
Nonlinear relationship between TyG-related indices and all-cause mortality among NAFLD/MASLD. The relationship was evaluated by RCS after adjustment for age, sex, race, income, marital status, education, smoking, sedentary lifestyle, diabetes, hypertension, plasma HDL-C, and FIB-4 (model 2). The solid lines in the figure represents HRs, and the shaded regions represents the 95% CIs. (A) TyG index in NAFLD; (B) TyG-BMI index in NAFLD; (C) TyG-WC index in NAFLD; (D) TyG index in MASLD; (E) TyG-BMI index in MASLD; (F) TyG-WC index in MASLD. BMI, Body mass index; CI, confidence intervals; FIB-4, Fibrosis-4 index; HDL-C, high-density lipoprotein cholesterol; HR, hazard ratios; MASLD, metabolic dysfunction-associated steatotic liver disease; NAFLD, non-alcoholic fatty liver disease; RCS, restricted cubic spline; TyG, triglyceride-glucose; WC, waist circumference

