
FIGURE 3.
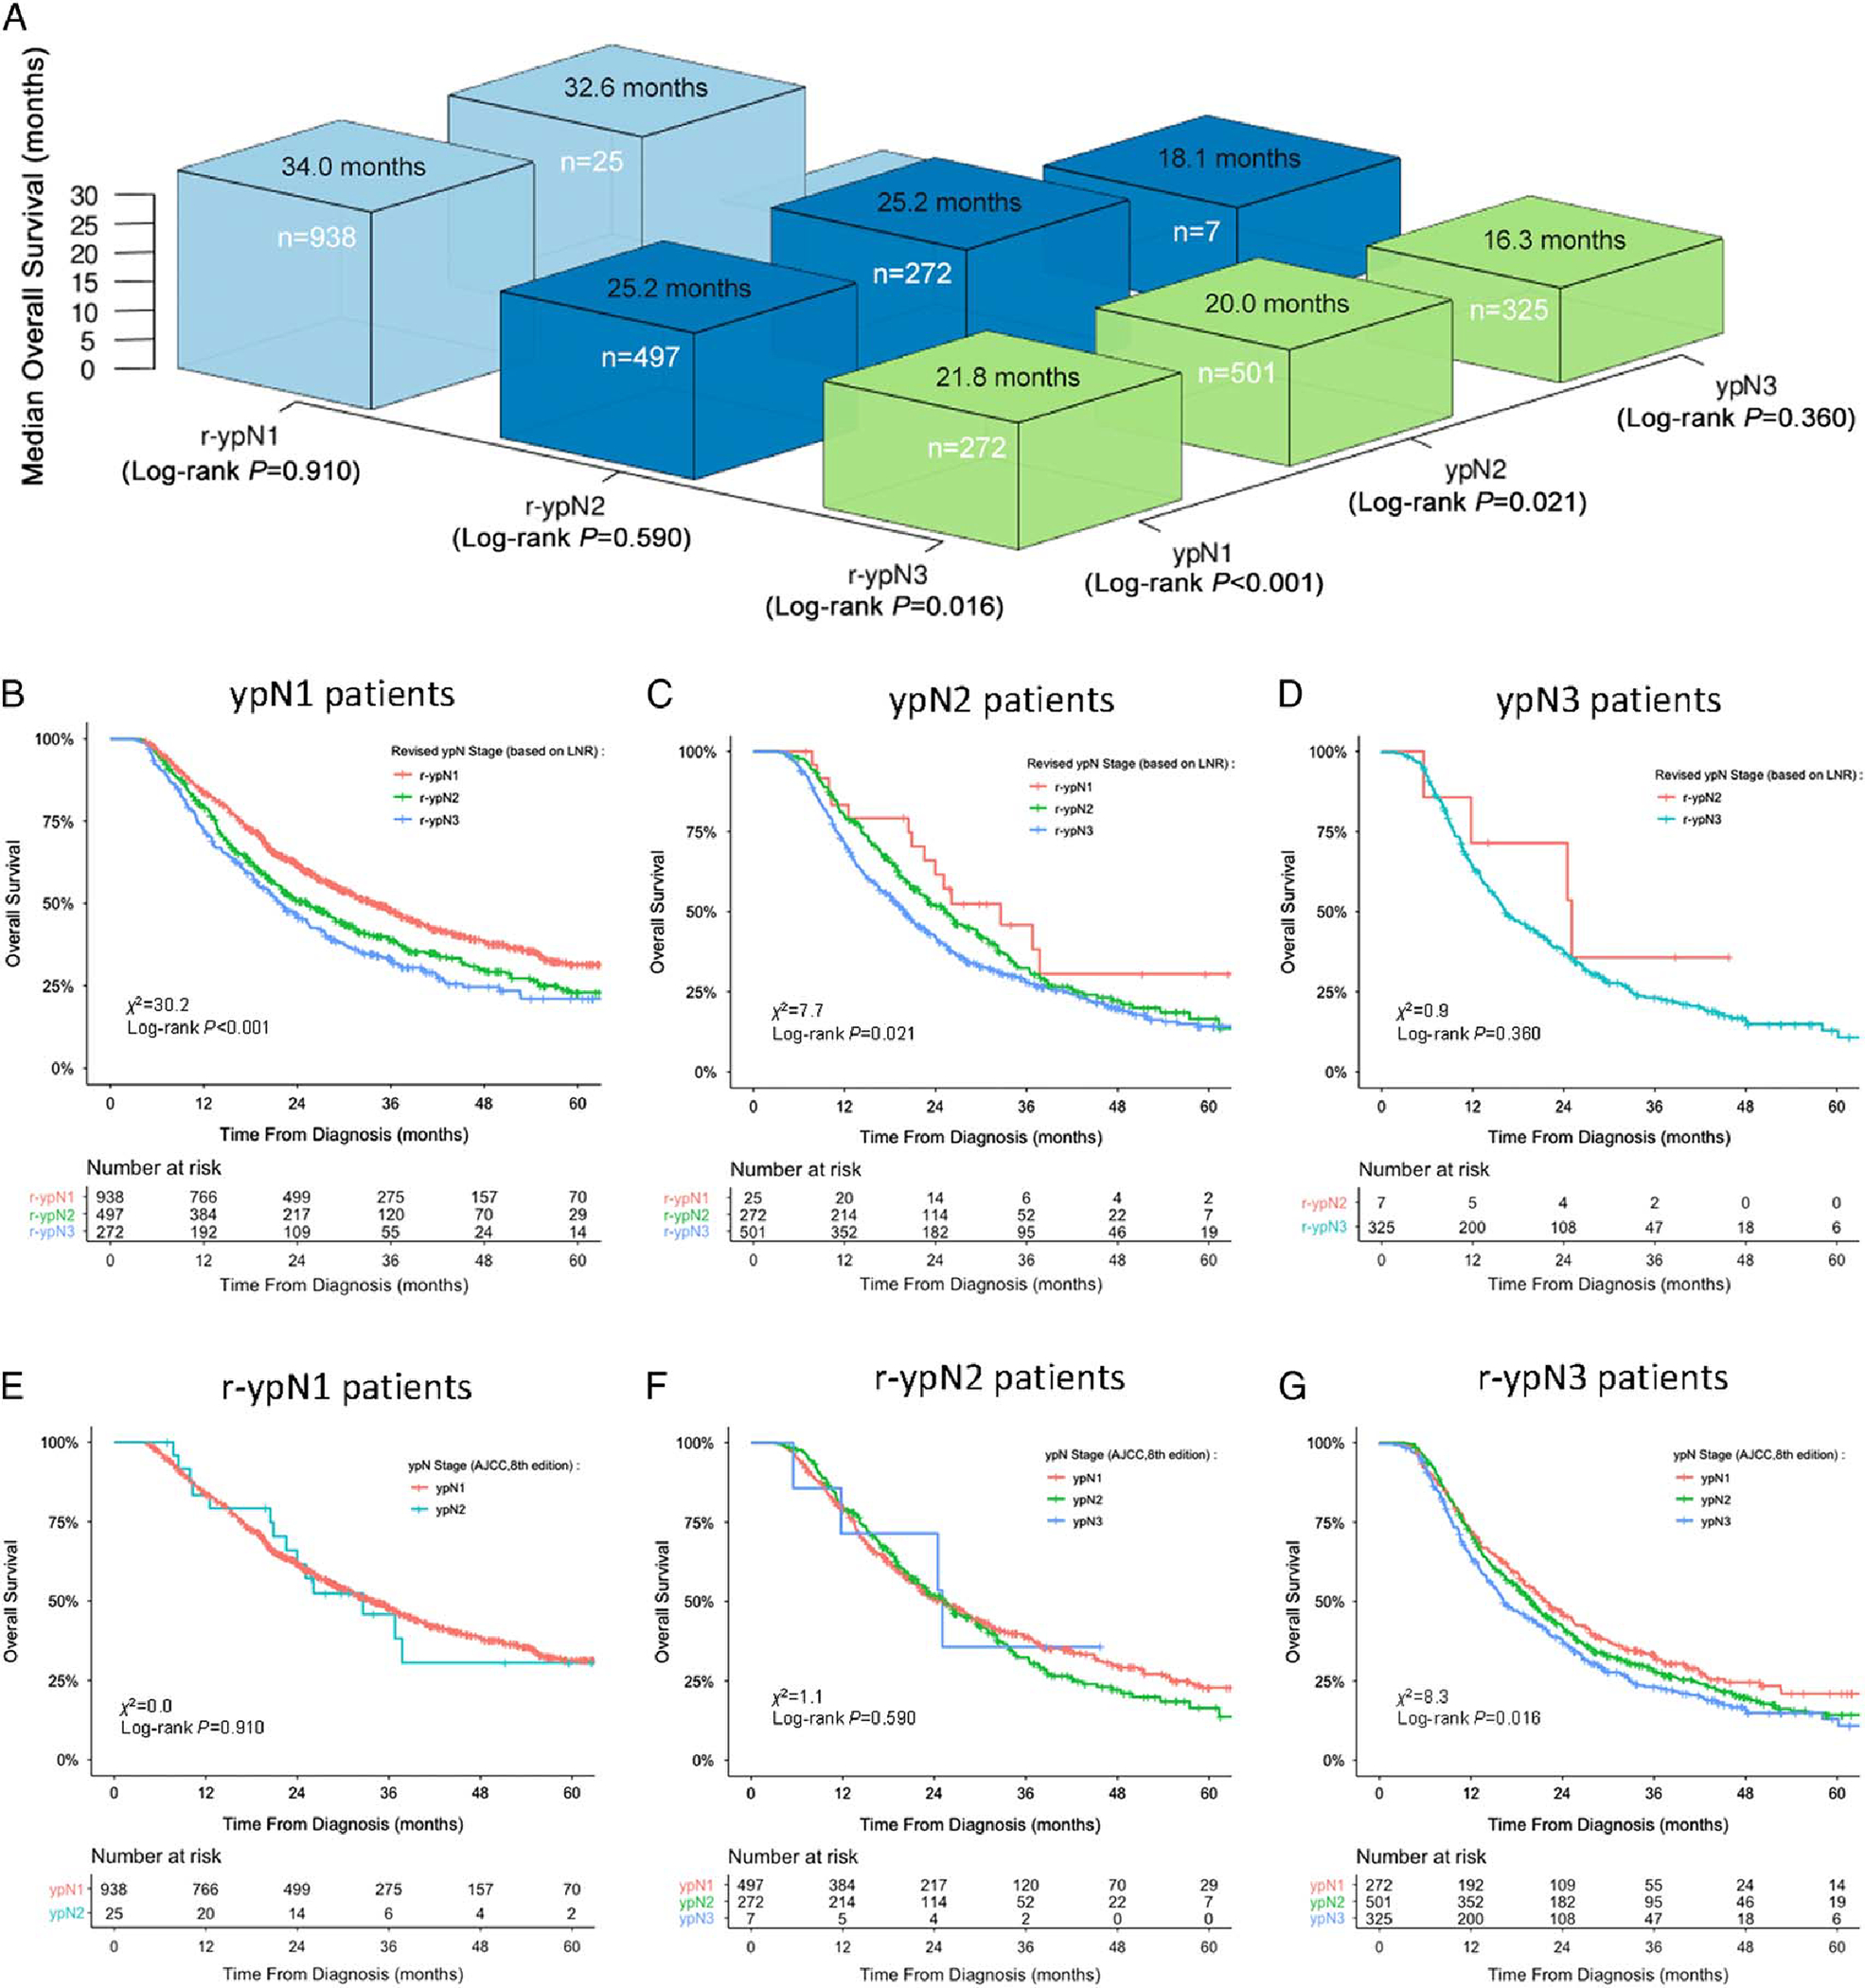
Reclassification of the pathologic nodal stage for prediction of OS. A, Three-dimensional bar plot of median survival times stratified by current and revised pN categories. B–D, Kaplan-Meier curves of OS of different subgroups stratified by r-ypN categories within each ypN group. E–G, Same curves in subgroups stratified by ypN stage within each r-ypN group.