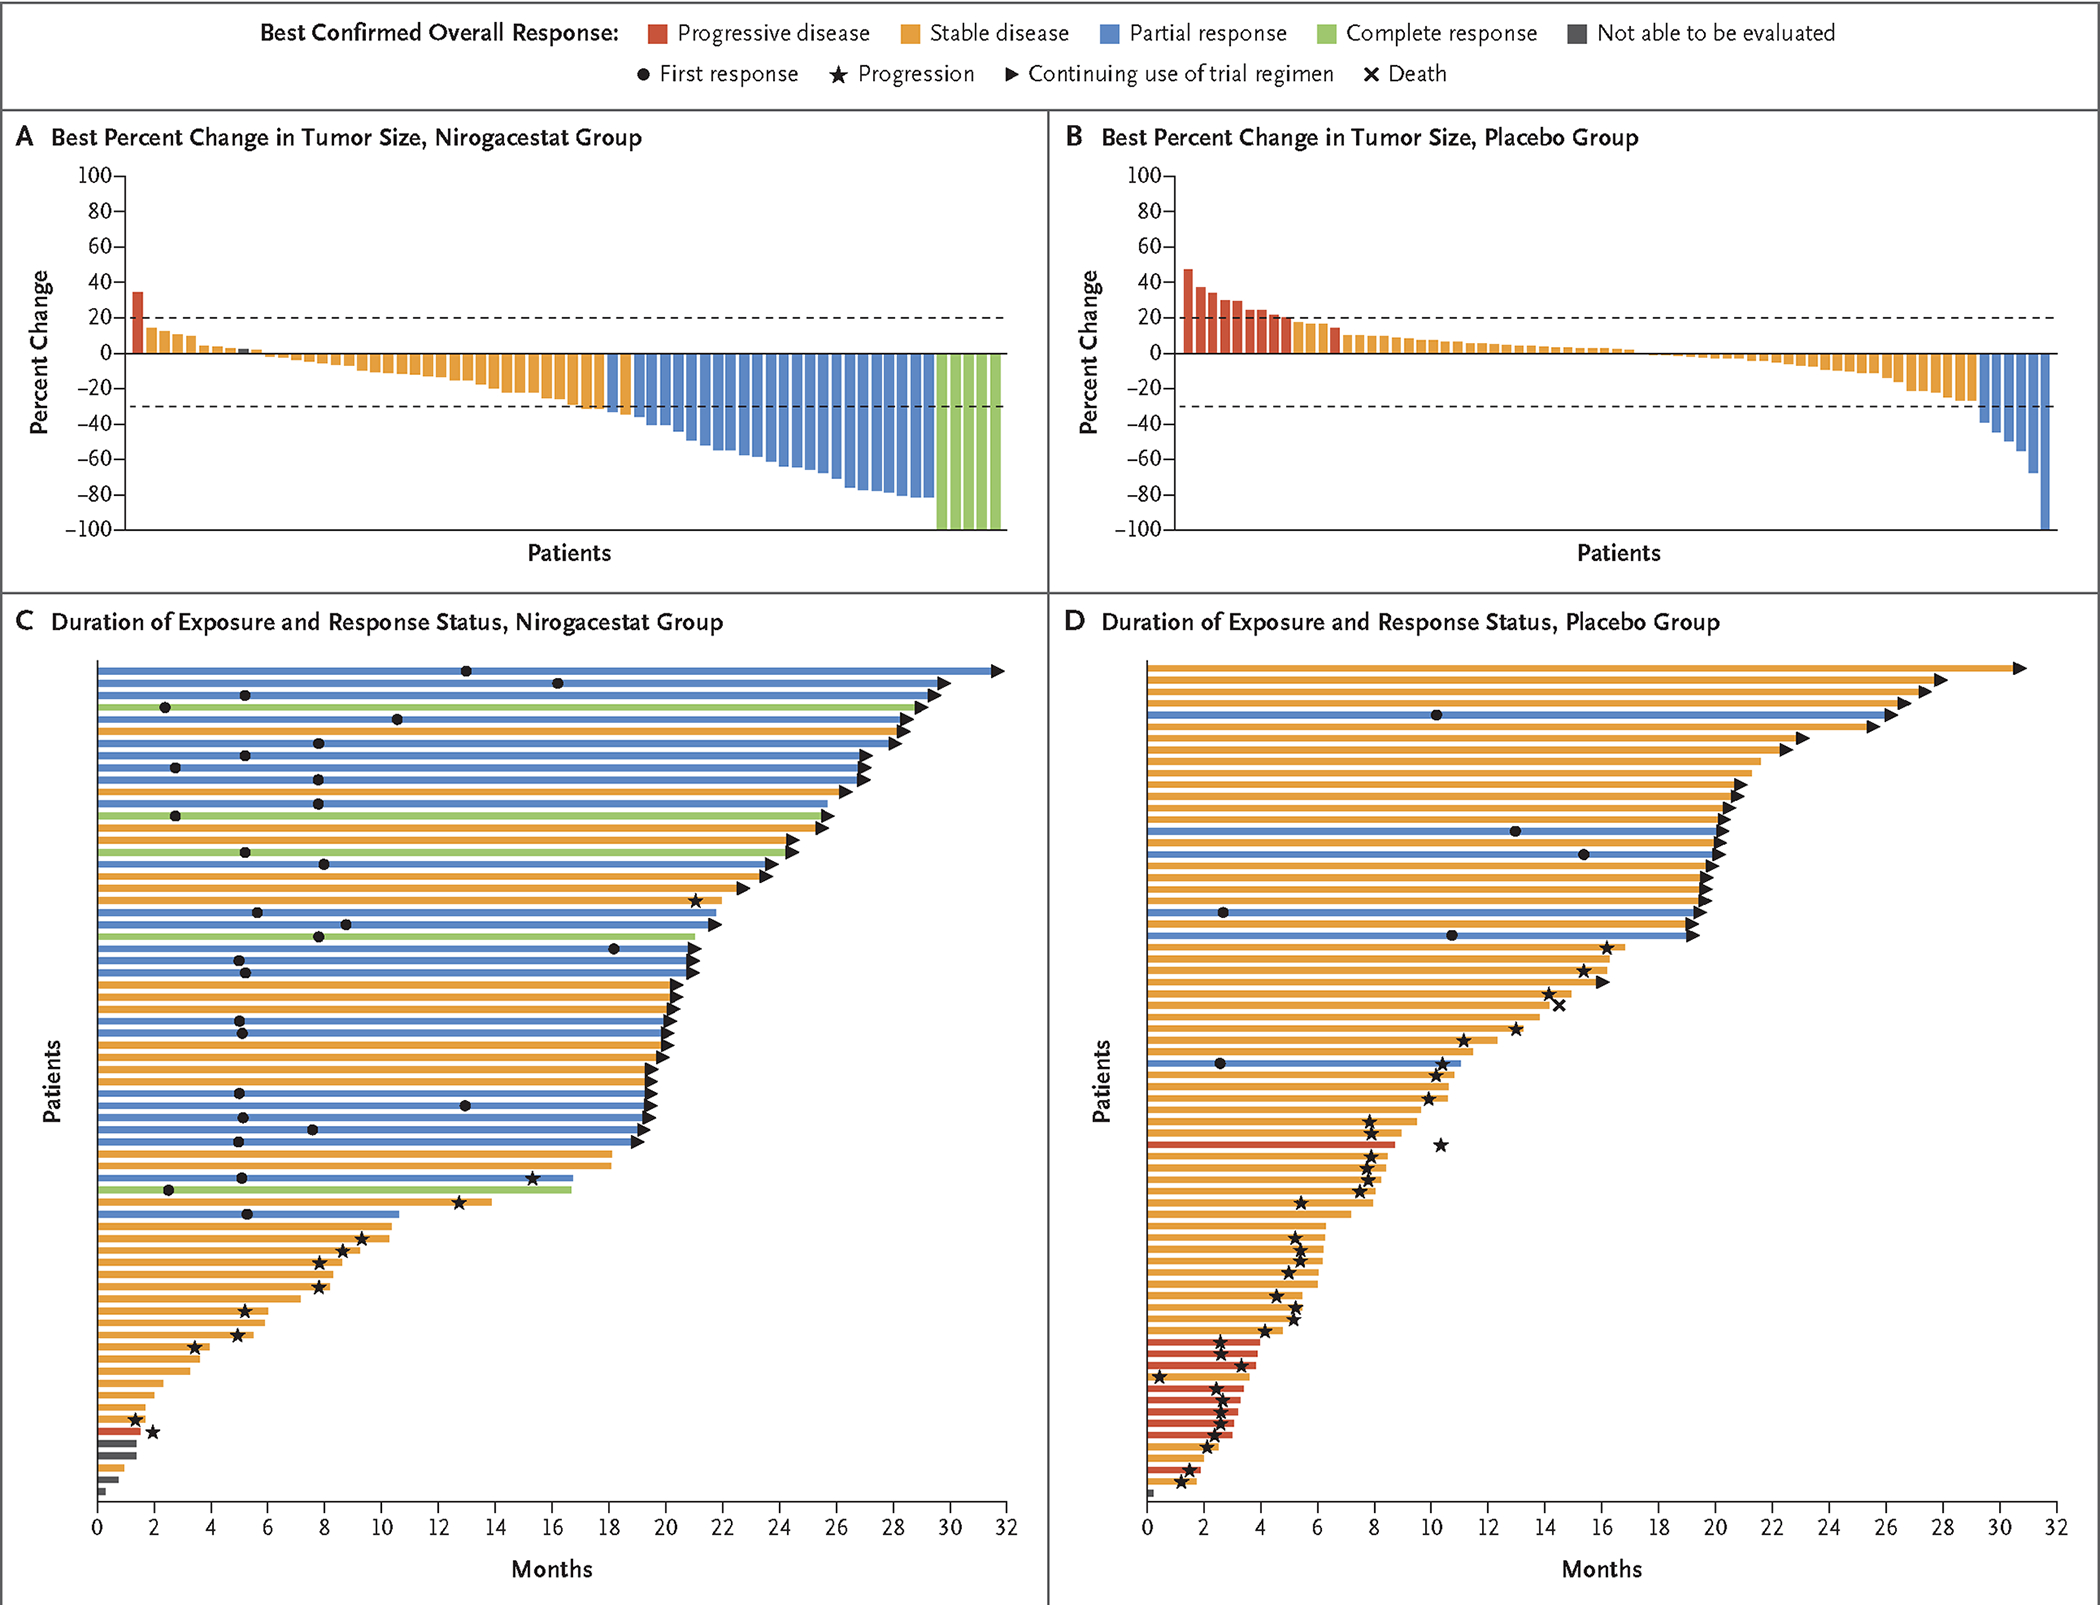
Figure 2. Change in Tumor Size and Best Overall Response.

Panels A and B show waterfall plots of the best percent change at any time point from baseline in target-tumor size per patient according to RECIST, version 1.1, through blinded independent central review in each trial group. Values for best percent change were averaged between the two independent reviewers unless a reader was selected for adjudication, in which case only the adjudicated value is presented. Panels C and D show swimmer plots of duration of exposure and response status in each trial group. Colors indicate the best overall response according to RECIST, version 1.1, through blinded independent central review.
