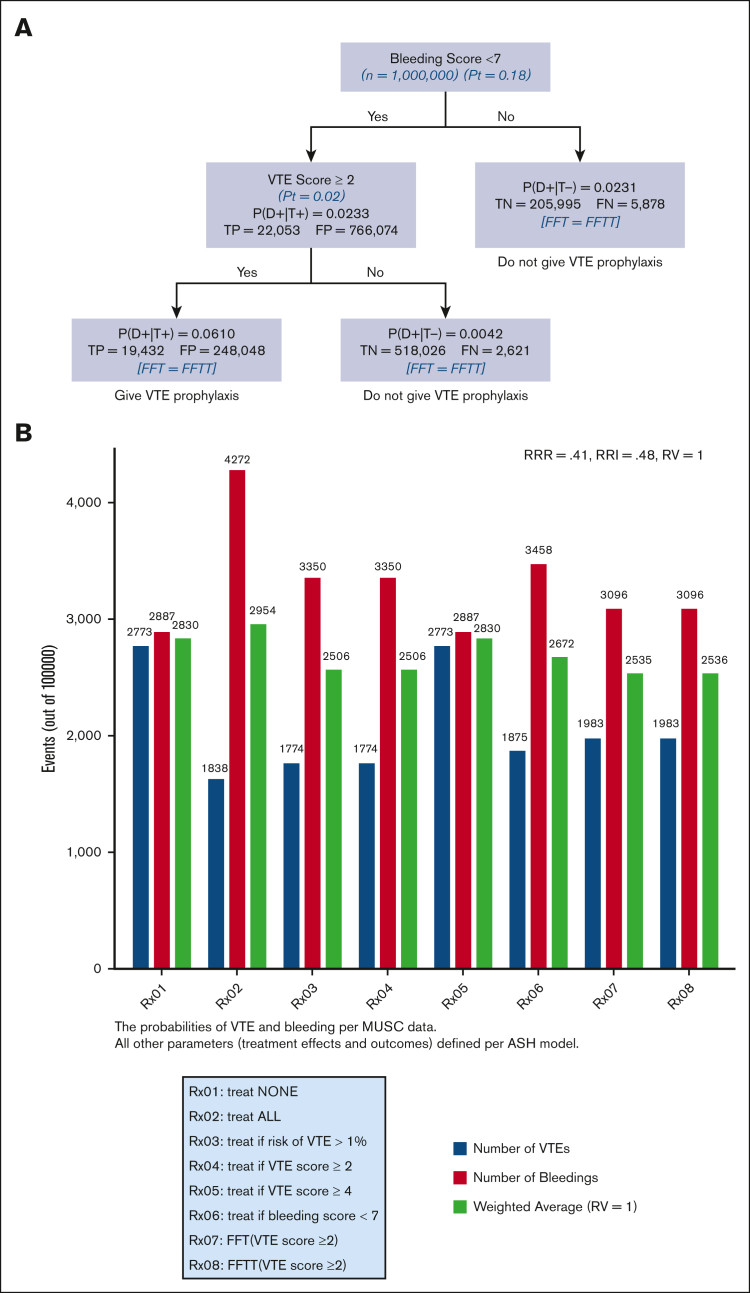
Figure 6.
FFT and FFTT decision trees analysis according to the “learning health system” paradigm, application of the best research evidence to local data. Here, it consisted of using MUSC bleeding and VTE risk scores ≥2 while using ASH guidelines as a source of the most reliable (“best”) evidence (A). The strategy with the lowest weighted average is considered the best (B). P(D+|T+)− probability of VTE if the test is “positive” that is, IMPROVE score exceeds given score (= PPV); P(D+|T−)− probability of VTE if the test is “negative” that is, IMPROVE score <given score.

