

Abstract
Chronic antigen exposure during viral infection or cancer promotes an exhausted T cell (Tex) state with reduced effector function. However, whether all antigen-specific T cell clones follow the same Tex differentiation trajectory remains unclear. Here, we generate a single-cell multi-omic atlas of T cell exhaustion in murine chronic viral infection that redefines Tex phenotypic diversity, including two late-stage Tex subsets with either a terminal exhaustion (Texterm) or a killer cell lectin-like receptor (KLR)-expressing cytotoxic phenotype (TexKLR). We use paired single-cell RNA and T cell receptor (TCR) sequencing to uncover clonal differentiation trajectories of Texterm-biased, TexKLR-biased, or divergent clones that acquire both phenotypes. We show that high TCR signaling avidity correlates with Texterm, while low avidity correlates with effector-like TexKLR fate. Finally, we identify similar clonal differentiation trajectories in human tumor-infiltrating lymphocytes. These findings reveal clonal heterogeneity in the T cell response to chronic antigen that influences Tex fates and persistence.
Chronic antigen exposure during viral infections and cancer leads to impaired CD8+ T cell responses characterized by reduced effector function, diminished proliferative capacity, and high expression of inhibitory receptors, including PD-1, LAG-3, and TIM3, termed T cell exhaustion1,2. However, exhausted T cells (Tex) maintain some effector functions and persist long-term, suggesting that Tex may control pathogen burden while maintaining immune homeostasis3,4. Recent studies have identified heterogeneity in Tex phenotypes characterized by distinct surface receptors, functionality, proliferative capacity, and tissue localization5–12. Some studies support a linear differentiation model, whereby TCF1+CXCR5+PD-1+ progenitor Tex (Texprog) self-renew and maintain downstream Tex subsets, including CX3CR1+PD-1+ intermediate Tex (Texint) and PD-1+TIM3+ terminal Tex (Texterm)5–9,13–15. These subpopulations exhibit distinct epigenetic states with TCF1 and BACH2 driving Texprog formation, while the high mobility group transcription factor (TF), TOX, orchestrates the exhaustion program in all Tex states4,7,16–21. Finally, Tex subsets are further distinguished by their ability to respond to immune checkpoint blockade (ICB); Texterm possess a stable epigenetic program and cannot be reinvigorated by ICB, while Texprog can proliferate in response to ICB and may be important for therapeutic response3,6,22. Despite these advances, we lack a comprehensive view of Tex states, their clonal relationships, and the molecular programs underlying their differentiation, particularly in polyclonal T cell responses.
Here, we generate a Tex differentiation atlas using single-cell chromatin accessibility, transcriptome, and T cell receptor (TCR) sequencing of antigen-specific CD8+ T cells during chronic lymphocytic choriomeningitis virus (LCMV) infection. We discover new Tex subsets, including an early effector exhausted subset (Texeeff) that initiates the molecular exhaustion program, and a killer cell lectin-like receptor-expressing Tex subset (TexKLR) which emerges as a late-stage phenotype concurrent with Texterm. T cell clone tracing with scRNA/TCR-seq nominates diverse Tex differentiation trajectories, including Texterm-biased, TexKLR-biased, or divergent fates, comprising both cell types. Tex clones traffic to multiple organ sites where their differentiation trajectories are conserved; however, TexKLR-biased clones are depleted in the liver, suggesting that Texterm may be phenotypically adapted for specific tissue microenvironments. Finally, we show that clone trajectories correlate with TCR signaling avidity; high-avidity TCR clones are biased towards Texterm, while low-avidity TCR clones are biased towards TexKLR. Overall, these results provide an in-depth view of the gene regulatory programs and clonal dynamics of Tex states during chronic infection.
A multi-omic atlas of T cell exhaustion
To profile CD8+ T cell exhaustion, we used mouse models of acute (LCMV Armstrong – Arm) or chronic (LCMV Clone 13 – Cl13) viral infection. These two viral strains share immunodominant epitopes, enabling direct comparison of antigen-specific T cell responses23. We generated paired single-cell RNA- and T cell receptor (TCR)-sequencing (scRNA/TCR-seq) and single-cell assay for transposase accessible chromatin with sequencing (scATAC-seq) data from LCMV glycoprotein 33–41 tetramer positive (gp33+) and tetramer negative (gp33−) splenic CD8+ T cells at Day 8 (D8) and Day 21 (D21) post-infection (Fig. 1a-d). At D21 of Cl13 infection, we also generated scRNA/TCR-seq of gp33+ and gp33− populations from two additional organs (lung and liver; Fig. 1a,c and Extended Data Fig. 1a). Finally, we sorted D21 Cl13 splenic T cells using previously defined surface markers that identify Texprog (PD-1+SLAMF6+), Texint (PD-1+CX3CR1+), and Texterm (PD-1+SLAMF6−CX3CR1−) phenotypes and performed scRNA/TCR- and scATAC-seq (Extended Data Fig. 1b)7–9,13. In total, we obtained 96,750 scRNA-seq profiles that passed quality control and detected TCR alpha and beta sequences in 88,696 T cells (91.7%), comprising 5,197 expanded T cell clones (clones >1 cell; Fig. 1c and Extended Data Fig. 1c). In addition, we obtained 62,731 scATAC-seq profiles that passed quality control (Fig. 1d, Extended Data Fig. 1d,e).
Figure 1. Single-cell genomic atlas of T cell exhaustion during LCMV infection.
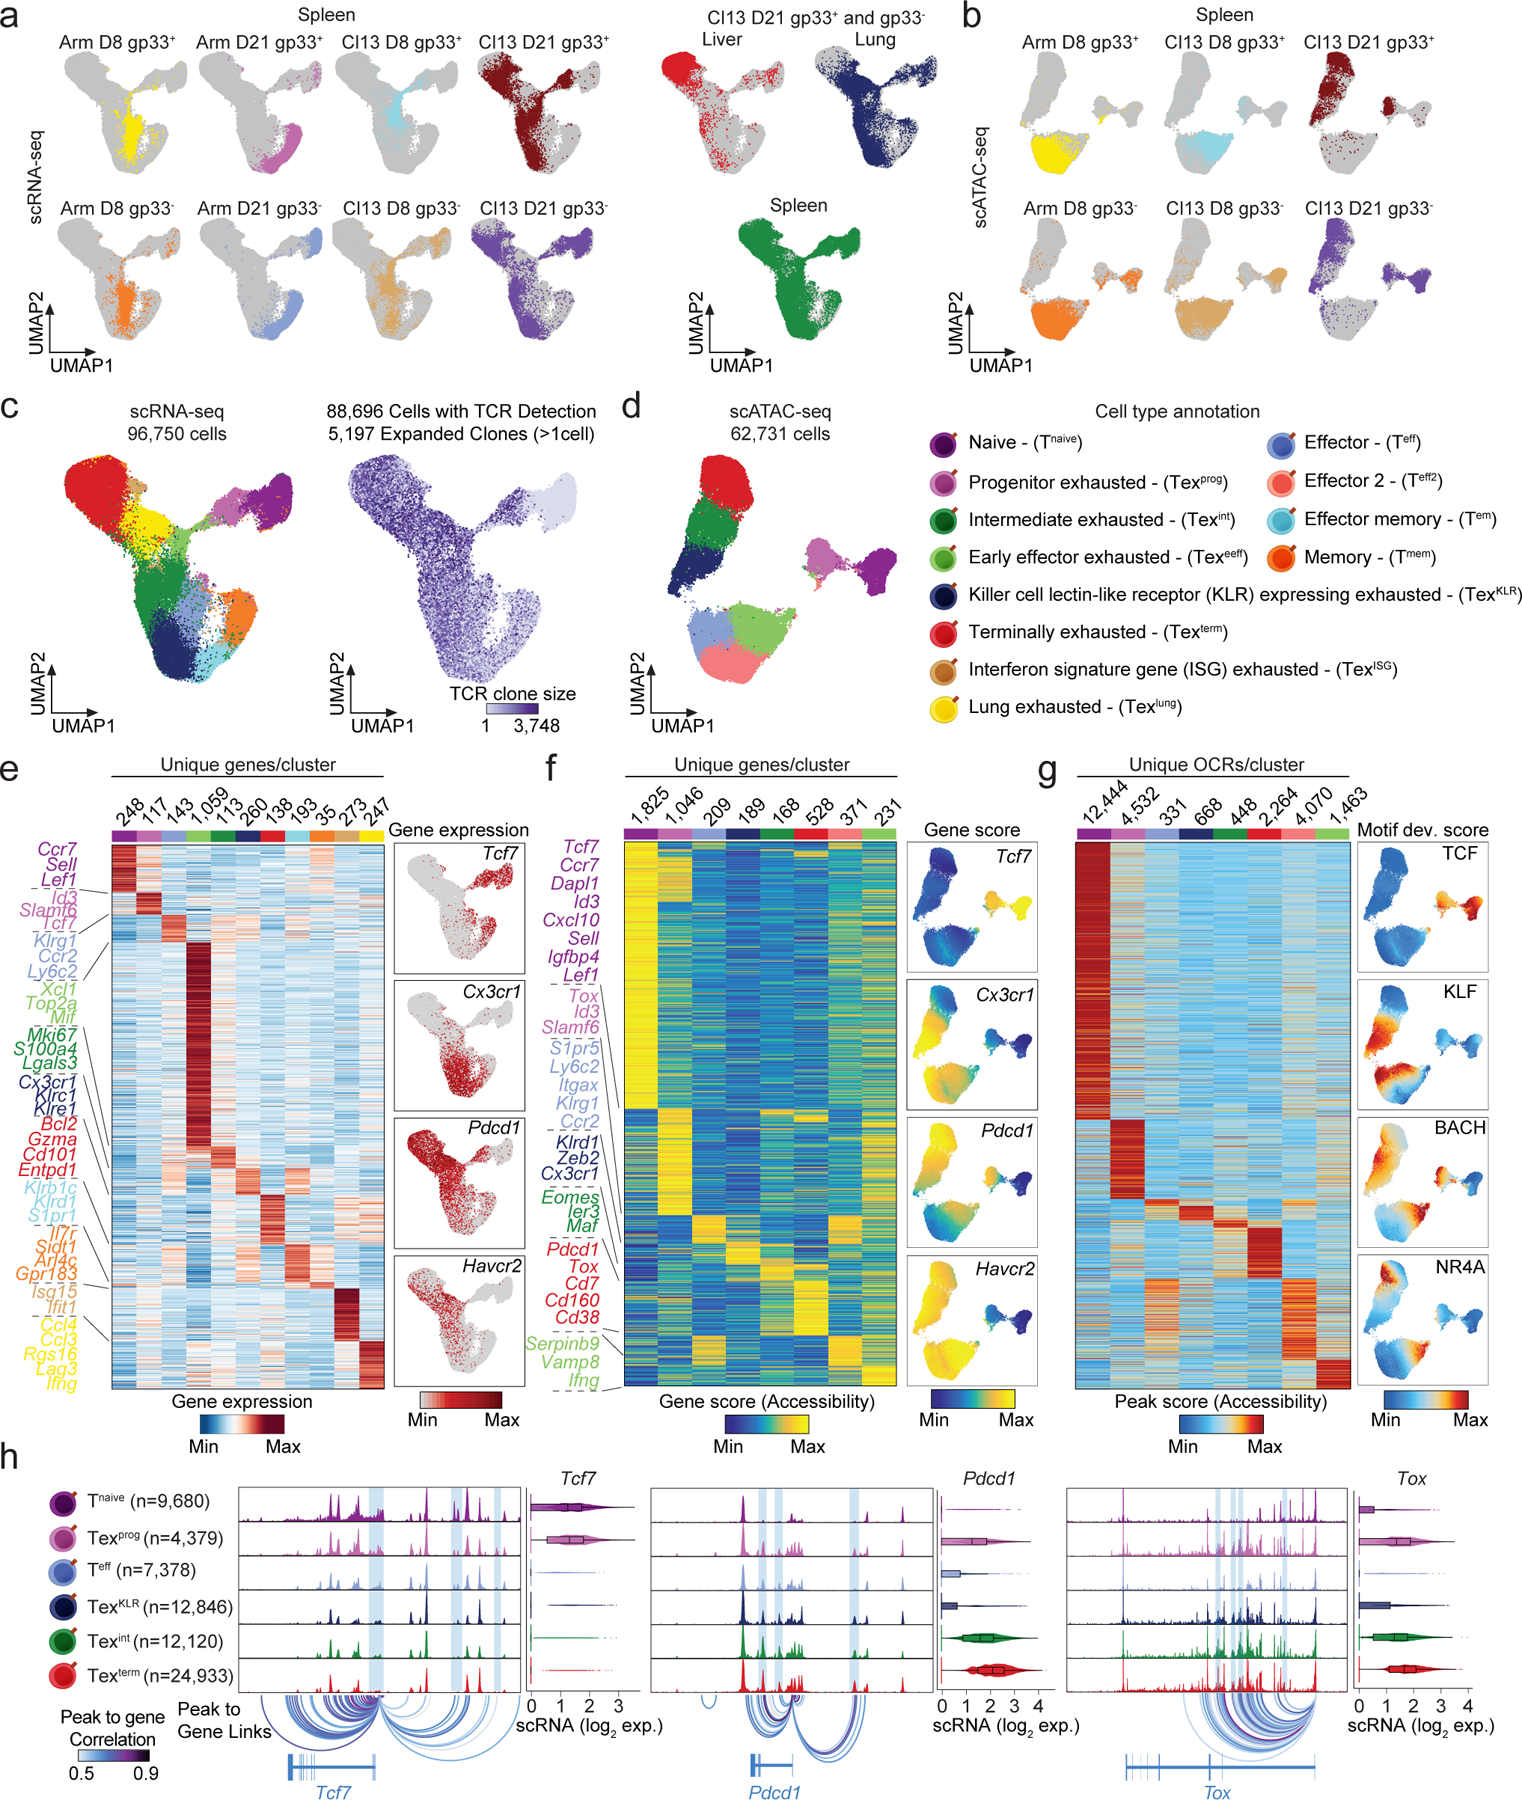
(a) scRNA-seq UMAPs colored by sample. (b) scATAC-seq UMAPs colored by sample. (c) scRNA-seq UMAP colored by annotated T cell subsets (left) or T cell clone size assigned by scTCR-seq (right). (d) scATAC-seq UMAP colored by annotated T cell subsets. (e) Heat map of subset specific marker genes determined by scRNA-seq (left, log2 FC >0.25, Bonferroni adjusted p-value <0.01, two-sided Wilcoxon Rank Sum test). Feature plots of T cell subset specific gene markers (right). (f) Heat map of Gene score values (weighted accessibility at gene locus) determined by scATAC-seq (left, log2 FC >0.5, FDR <0.01, two-sided Wilcoxon Rank Sum test adjusted using Benjamini & Hochberg procedure). Feature plots of T cell subset specific Gene score values (right). (g) Heat map of Peak score values at unique open chromatin regions (OCRs) of T cell subsets determined by scATAC-seq (left, log2 FC >1, FDR <0.05, two-sided Wilcoxon Rank Sum test adjusted using Benjamini & Hochberg procedure). Feature plots of chromVAR deviation scores for T cell subset specific motifs (right). (h) Genome accessibility tracks of indicated gene loci in Tex subsets. Violin plots of gene expression determined by scRNA-seq (n = number of scRNA-seq profiles; box center line, median; limits, upper and lower quartiles; whiskers, 1.5× interquartile range).
We performed uniform manifold approximation and projection (UMAP) for dimensionality reduction and identified 11 scRNA-seq clusters, which were annotated based on differentially expressed genes (DEGs). In Arm infection, we observed naïve T cells (Tnaive; Ccr7, Sell, Lef1), effector T cells (Teff; Klrg1, Ly6c2), effector memory T cells (Tem; Klrb1c, Klrd1, S1pr1), and memory T cells (Tmem; Il7r, Arl4c, Il18r1; Fig. 1e, Supplementary Table 1). In Cl13 infection, we observed Texprog (Tcf7, Slamf6, Id3), Texint (Lgals3, S100a4, Mki67), and Texterm (Gzma, Cd101, Entpd1), as expected (Fig. 1c,e). In addition, we also observed early effector exhausted cells (Texeeff; Xcl1, Top2a, Mif; a predominant population at D8 of C13 infection), killer cell lectin-like receptor (KLR)-expressing exhausted cells (TexKLR; S1pr5, Cx3cr1, Klrc1; emerging late in C13 infection), lung terminal exhausted cells (Texlung; Lag3, Ifng, Ccl4), and interferon signature gene (ISG) exhausted T cells (TexISG; Isg15, Ifit1, Isg20; Fig. 1c,e). We observed 8 analogous T cell populations in the scATAC-seq data based on integration with scRNA-seq data (Fig. 1d, Extended Data Fig. 1f). Since our goal was to analyze Tex epigenetic states, we did not perform scATAC-seq at D21 in Arm infection, or in lung or liver T cells in Cl13 infection; thus, scATAC-seq clusters did not include Tem, Tmem, or Texlung subsets. However, scATAC-seq clusters did reveal additional heterogeneity, consisting of two effector populations mainly derived from the Arm condition (Teff and Teff2) and an Texeeff population from the Cl13 condition (Fig. 1d,f).
scATAC-seq profiles were analyzed at the level of: (1) cis-regulatory element chromatin accessibility (open chromatin regions; OCRs), (2) gene activity scores, computed from OCR accessibility, weighted by distance, and (3) TF activity, computed from TF binding site enrichment in OCRs or genome-wide24,25. Cell type-specific OCR accessibility was correlated with gene expression at marker gene loci that define Tex subsets, including Tcf7, Pdcd1, and Tox (Fig. 1g,h, Supplementary Table 2). Tnaive-specific OCRs were enriched for the TCF/LEF motifs, which were also enriched in Texprog, along with other known Texprog TFs (e.g., BATF, AP-1 and BACH)14,18,26,27. Texeeff showed NFAT motif enrichment, while KLF motifs were specifically enriched in the Texint, Teff, and TexKLR populations. Finally, Texterm-specific OCRs exhibited strong enrichment for NR4A, RUNX and NFAT TF motifs (Extended Data Fig. 1g, Supplementary Table 3)28–31.
CX3CR1+ Tex comprise two functionally distinct subsets
We next examined heterogeneity within CX3CR1+ Tex cells, which have recently been described as a functional intermediate cell state between Texprog and Texterm8,9,13. scRNA-seq of sorted CX3CR1+ T cells from D21 of Cl13 infection revealed heterogeneity that primarily spanned two distinct phenotypes (Texint and TexKLR; Fig. 2a). To understand the transcriptional programs that distinguish Texint from TexKLR, we performed DEG analysis and found 206 TexKLR-biased genes and 384 Texint-biased genes (Fig. 2b, Supplementary Table 4). Pathway analysis revealed enrichment for T cell exhaustion-related biological terms in Texint, cell cycle related terms in both populations, and T cell activation/motility-related terms in TexKLR (Extended Data Fig. 2a). Notably, many markers of terminal effector and effector memory T cells, such as the killer cell lectin-like receptor (KLR) family members (e.g., Klrd1, Klrk1, Klrc1, Klre1 and Klrg1), the TF Zeb2, and its target gene, S1pr5 (a marker of tissue emigrating T cells), showed a highly specific expression pattern in TexKLR32,33. In contrast, Texint expressed canonical exhaustion markers (e.g., Ctla4, Pdcd1, Lag3) and TCR signaling genes (e.g., Lck, Coro1a) (Fig. 2b). Similar gene expression signatures were detected when comparing TexKLR and Texterm with a more pronounced exhaustion signature in the latter (e.g., Cxcr6, Cd101, Tigit) (Fig. 2b, Supplementary Table 5). To support an intermediate exhaustion state in Texint, we analyzed CXCR6 surface expression in Texprog (CX3CR1−SLAMF6+KLRG−), Texint (CX3CR1+SLAMF6−KLRG−), and Texterm (CX3CR1−SLAMF6−KLRG−) by flow cytometry, which showed intermediate CXCR6 expression in Texint, compared to Texterm and Texprog (Extended Data Fig. 2b).
Figure 2. Identification of intermediate, KLR-expressing, and organ-specific Tex subsets.

(a) scRNA-seq UMAP colored by T cell subset from sorted PD-1+CX3CR1+CD8+ T cells (left). Stacked bar plot of the sorted population phenotypic distribution (right) (b) Volcano plots of differentially expressed genes between indicated Tex populations (log2 FC >0.25, Bonferroni adjusted p-value <0.01, two-sided Wilcoxon Rank Sum test). (c) Heat map of scaled marker gene expression of terminal effector memory (T-Tem) cells (Milner et al. 2020) in indicated T cell subsets. (d) Violin plot of T-Tem gene signature score in indicated T cell subsets (n = number of scRNA-seq profiles, box center line, median; limits, upper and lower quartiles; whiskers, 1.5× interquartile range). (e) Representative IFNG/LAMP-1 flow cytometry plots of indicated Tex subsets (left). Boxplot quantifying IFNG+LAMP1+ percentage for indicated Tex subsets. Significance determined by two tailed, unpaired t-test (n = 5 biologically independent animals). Box center line, mean; limits, upper and lower quartiles; whiskers, minimum and maximum values. (f) scRNA-seq UMAP from three organs at D21 following Cl13 infection colored by annotated T cell subsets (g) Stacked bar plot of gp33+ phenotypic distribution of annotated T cell subsets in three organs (left). UMAPs colored by organ (right). (h) Heat map of scaled gene expression values of common exhaustion gene signature among Texterm from three organs. (i) Violin plot of Texterm exhaustion scores from the three organs (Im et al. 2016; n = number of scRNA-seq profiles; box center line, median; limits, upper and lower quartiles; whiskers, 1.5× interquartile range). P-values determined by two-sided Wilcoxon Rank Sum test. (j) Representative flow cytometry plots of Tex subsets detected in organs. (k) Quantification of the PD-1+ and PD-1− fractions of CD8+ T cells across organs. Significance determined by two tailed, unpaired t-test (n = 3 biologically independent animals). Shown are means with SDs. (l) Quantification of fractions of indicated Tex subsets across organs. Significance determined by two tailed, unpaired t-test (n = 3 biologically independent animals). Shown are means with SDs.
Next, we focused on TexKLR and assessed the gene signature of terminal effector memory T cells (T-Tem), a recently described Tem subset identified during acute LCMV infection which express effector T cell markers, including KLRs34. The T-Tem gene signature was highly expressed in TexKLR, suggesting that this subset may represent a parallel differentiation path to T-Tem (Fig. 2c,d). Finally, we assessed the functionality and proliferative capacity of gp33-specific Texterm, Texint, and TexKLR (CX3CR1+KLRG1+SLAMF6−) by measuring IFNG, LAMP-1 (cytotoxic degranulation marker), and MKI67 using flow cytometry. These analyses demonstrated superior functional and proliferative capacity of TexKLR, compared to Texterm and Texint (Fig. 2e; Extended Data Fig. 2c). In summary, the CX3CR1+ T cell pool contains two Tex subsets with distinct surface and functional phenotypes.
Tex acquire organ-specific terminal exhaustion signatures
We re-clustered scRNA-seq profiles from gp33+ and gp33− CD8+ T cells from the spleen, lung, and liver at D21 of Cl13 infection and examined Tex subset distribution across organs (Fig. 2f). Relative to splenic T cells, cells in the lung exhibited an alternative terminal exhausted phenotype (Texlung) and a reduced Texprog population, with similar TexKLR and Texint proportions (Fig. 2f,g). Strikingly, T cells in the liver almost exclusively adopted the Texterm phenotype, as previously described (93.9% Texterm; Fig. 2f,g) 15. We further examined tissue-specific differences in the exhaustion signature by pairwise DEG analyses. Compared to splenic Texterm, liver-derived Texterm possessed a strong tissue-resident memory T cell signature (e.g., Cd69, Cxcr6, Ccl3) and a gene program linked to TNF-, and glucocorticoid signaling (Extended Data Fig. 2d, Supplementary Table 6). Similarly, lung-derived Texterm also exhibited typical markers of lung-resident memory T cells (e.g., Cxcr6, Cd44) and several integrin genes (e.g., Itga4, Itgab7, Itgab1; Extended Data Fig. 2d, Supplementary Table 7). Furthermore, both liver- and lung-derived Texterm expressed higher levels of pro-survival genes (e.g., Bcl2, Bcl2a1b, Bcl2a1d) than splenic Texterm (Extended Data Fig. 2d, Supplementary Table 8). These results suggest that Texterm can obtain tissue residency programs and persist in tissues in the setting of chronic antigen.
Despite tissue-specific differences, we observed a common Texterm gene signature across all organs. This signature (n=35 genes) contained previously described exhaustion-related genes, such as immune checkpoint inhibitory receptors, Pdcd1 and Tox (Fig. 2h). Next, we ranked the severity of exhaustion among Texterm from each organ using a previously defined exhaustion gene signature6. We observed that liver-derived Texterm scored the highest, followed by splenic and lung-derived Texterm (Fig. 2i). In line with these findings, flow cytometry analysis demonstrated increased frequencies of Texterm in the liver (88% of PD1+CD8+ T cells), compared to the spleen (47%) and lung (51%; Fig. 2j,k,l). In contrast, we observed the highest frequency of Texprog in the spleen (18.3% of PD1+CD8+ T cells). Texint and TexKLR were increased in the spleen (Texint: 32.33%; TexKLR: 6.59% of PD1+CD8+ T cells) and lung (Texint: 44.77%; TexKLR: 10.01%), compared to the liver (Texint: 10.72%; TexKLR: 2.58%; Fig. 2j,k,l). We also scored Texterm and Texint profiled by scRNA-seq based on cell cycle activity, which ranked liver-derived cells as the least proliferative, followed by the lung and spleen, inversely correlating with the severity of exhaustion, and we confirmed these observations with flow cytometry (Extended Data Fig. 2e,f). These results demonstrate that T cell exhaustion develops across multiple organs with a common gene expression signature but microenvironment-specific effects.
Clone tracing reveals divergent Tex differentiation fates
We next leveraged paired scRNA/TCR-seq data to analyze clonal trajectories of gp33+ and gp33− (other reactive clones and non-reactive Tnaive cells) T cells during Arm and Cl13 (D8 and D21) infection in the spleen (Fig. 3a). We identified 212 and 280 expanded gp33+ T cell clones (>1 cell; 53 and 40 expanded clones/1,000 cells sequenced) at D8 and D21 of Arm infection, respectively, and 134 and 338 expanded clones (95 and 36 expanded clones/1,000 cells sequenced) at D8 and D21 of Cl13 infection, respectively. At D8 of Arm infection, clonally expanded gp33+ T cells were largely restricted to the Teff pool, while at D21, clonally expanded gp33+ T cells exhibited a balanced distribution between Tem and Tmem (Fig. 3b and Extended Data Fig. 3a). In contrast, clonal expansion in gp33+ T cells at D8 in Cl13 infection occurred almost exclusively in Texeeff (Fig. 3c). Importantly, the Texprog population showed weak clonal expansion at D8. However, at D21, gp33+ specific expanded clones adopted all Tex phenotypes (Figure 3c,d and Extended Data Fig. 3b).
Figure 3. TCR-based lineage tracing reveals divergent Tex clonal trajectories.
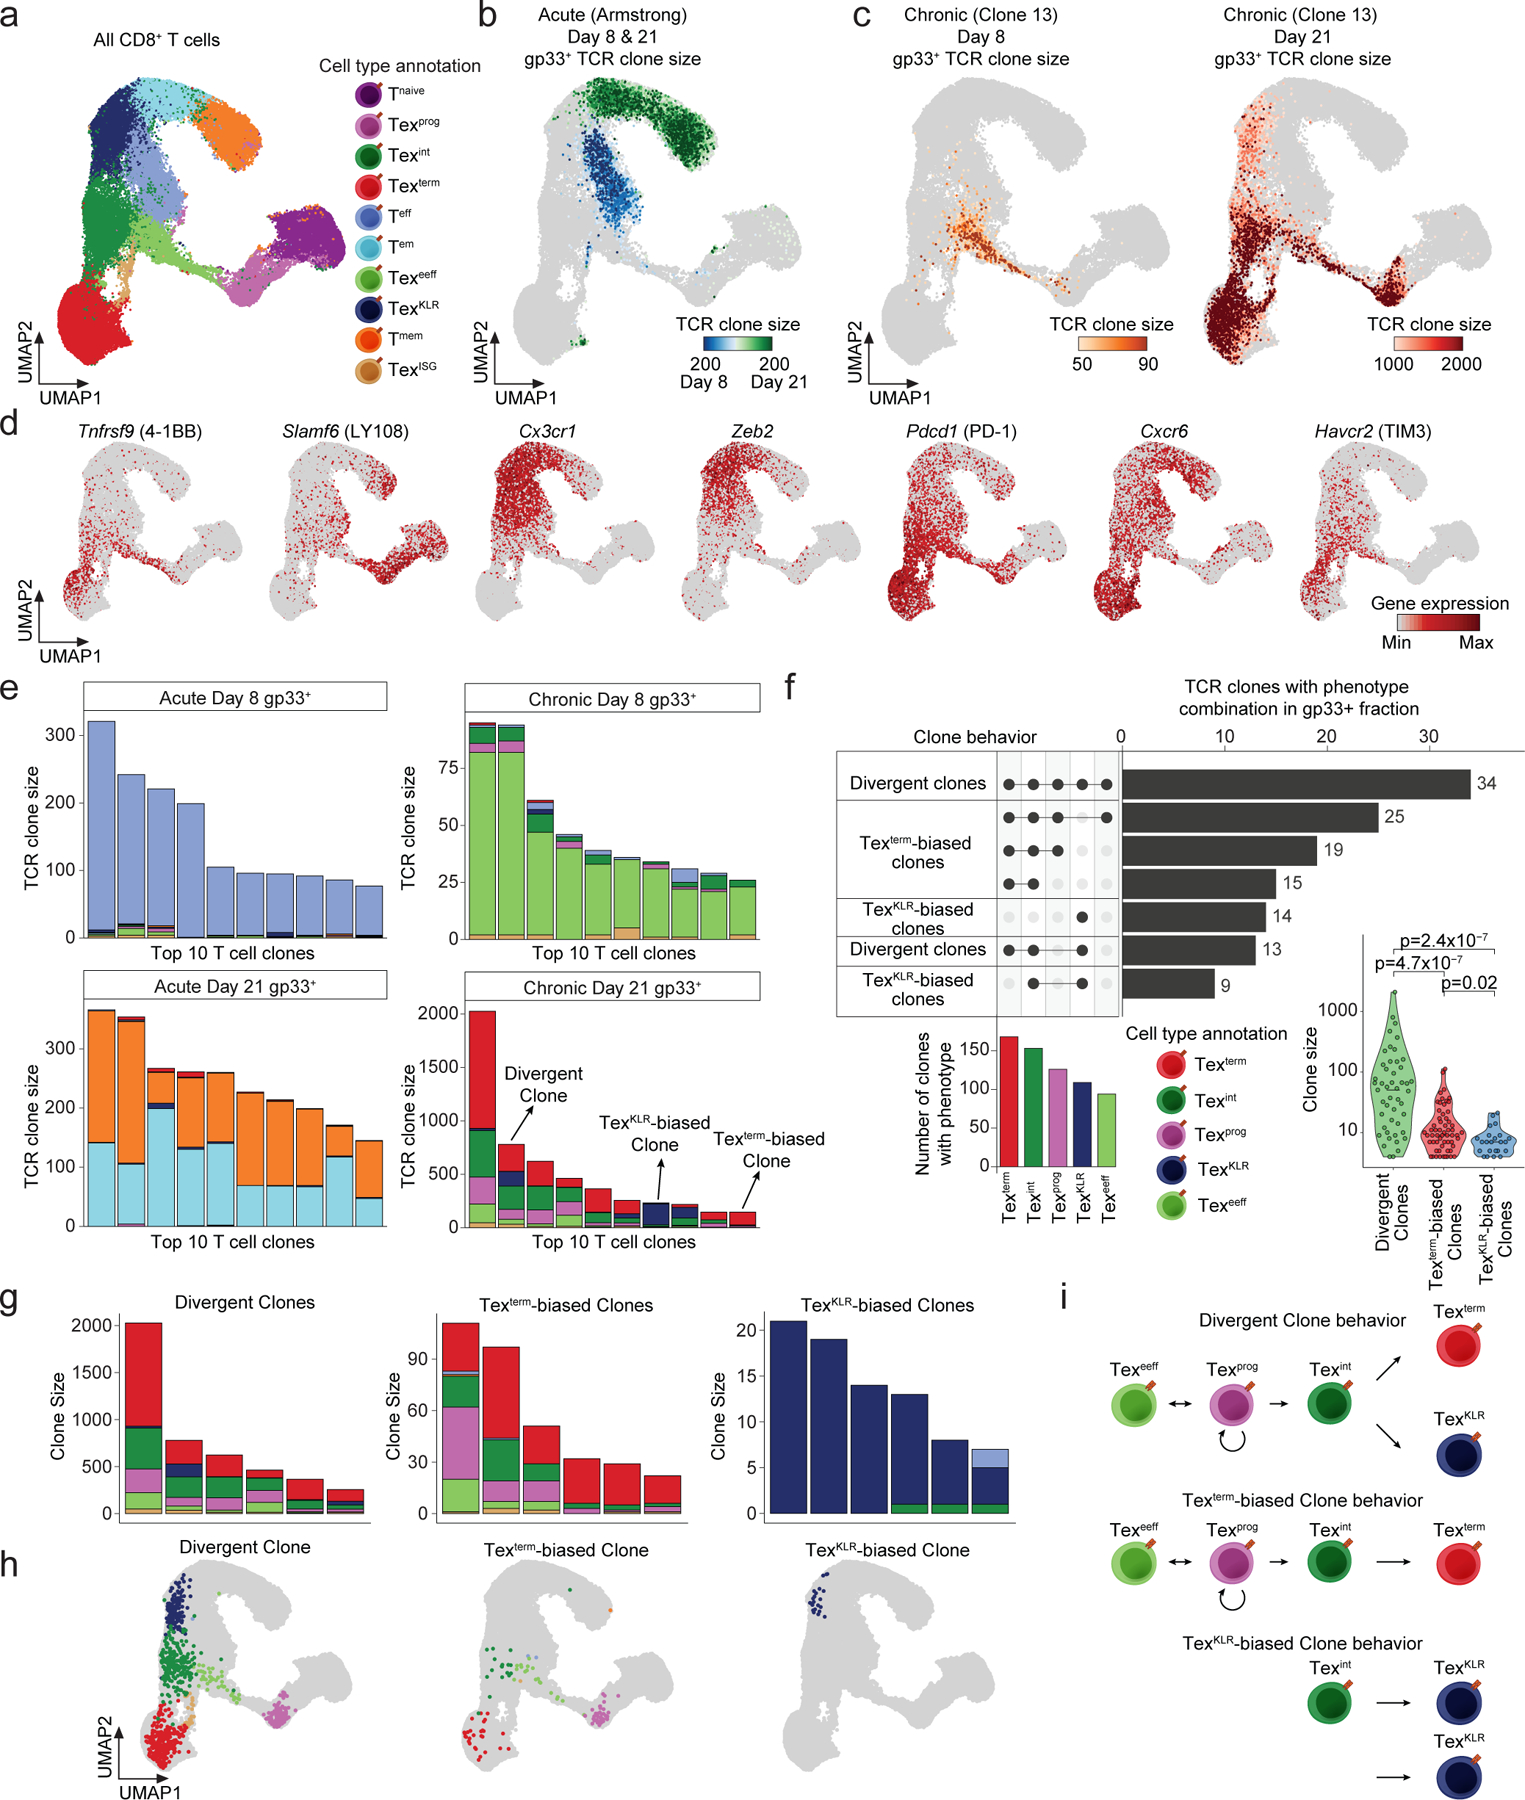
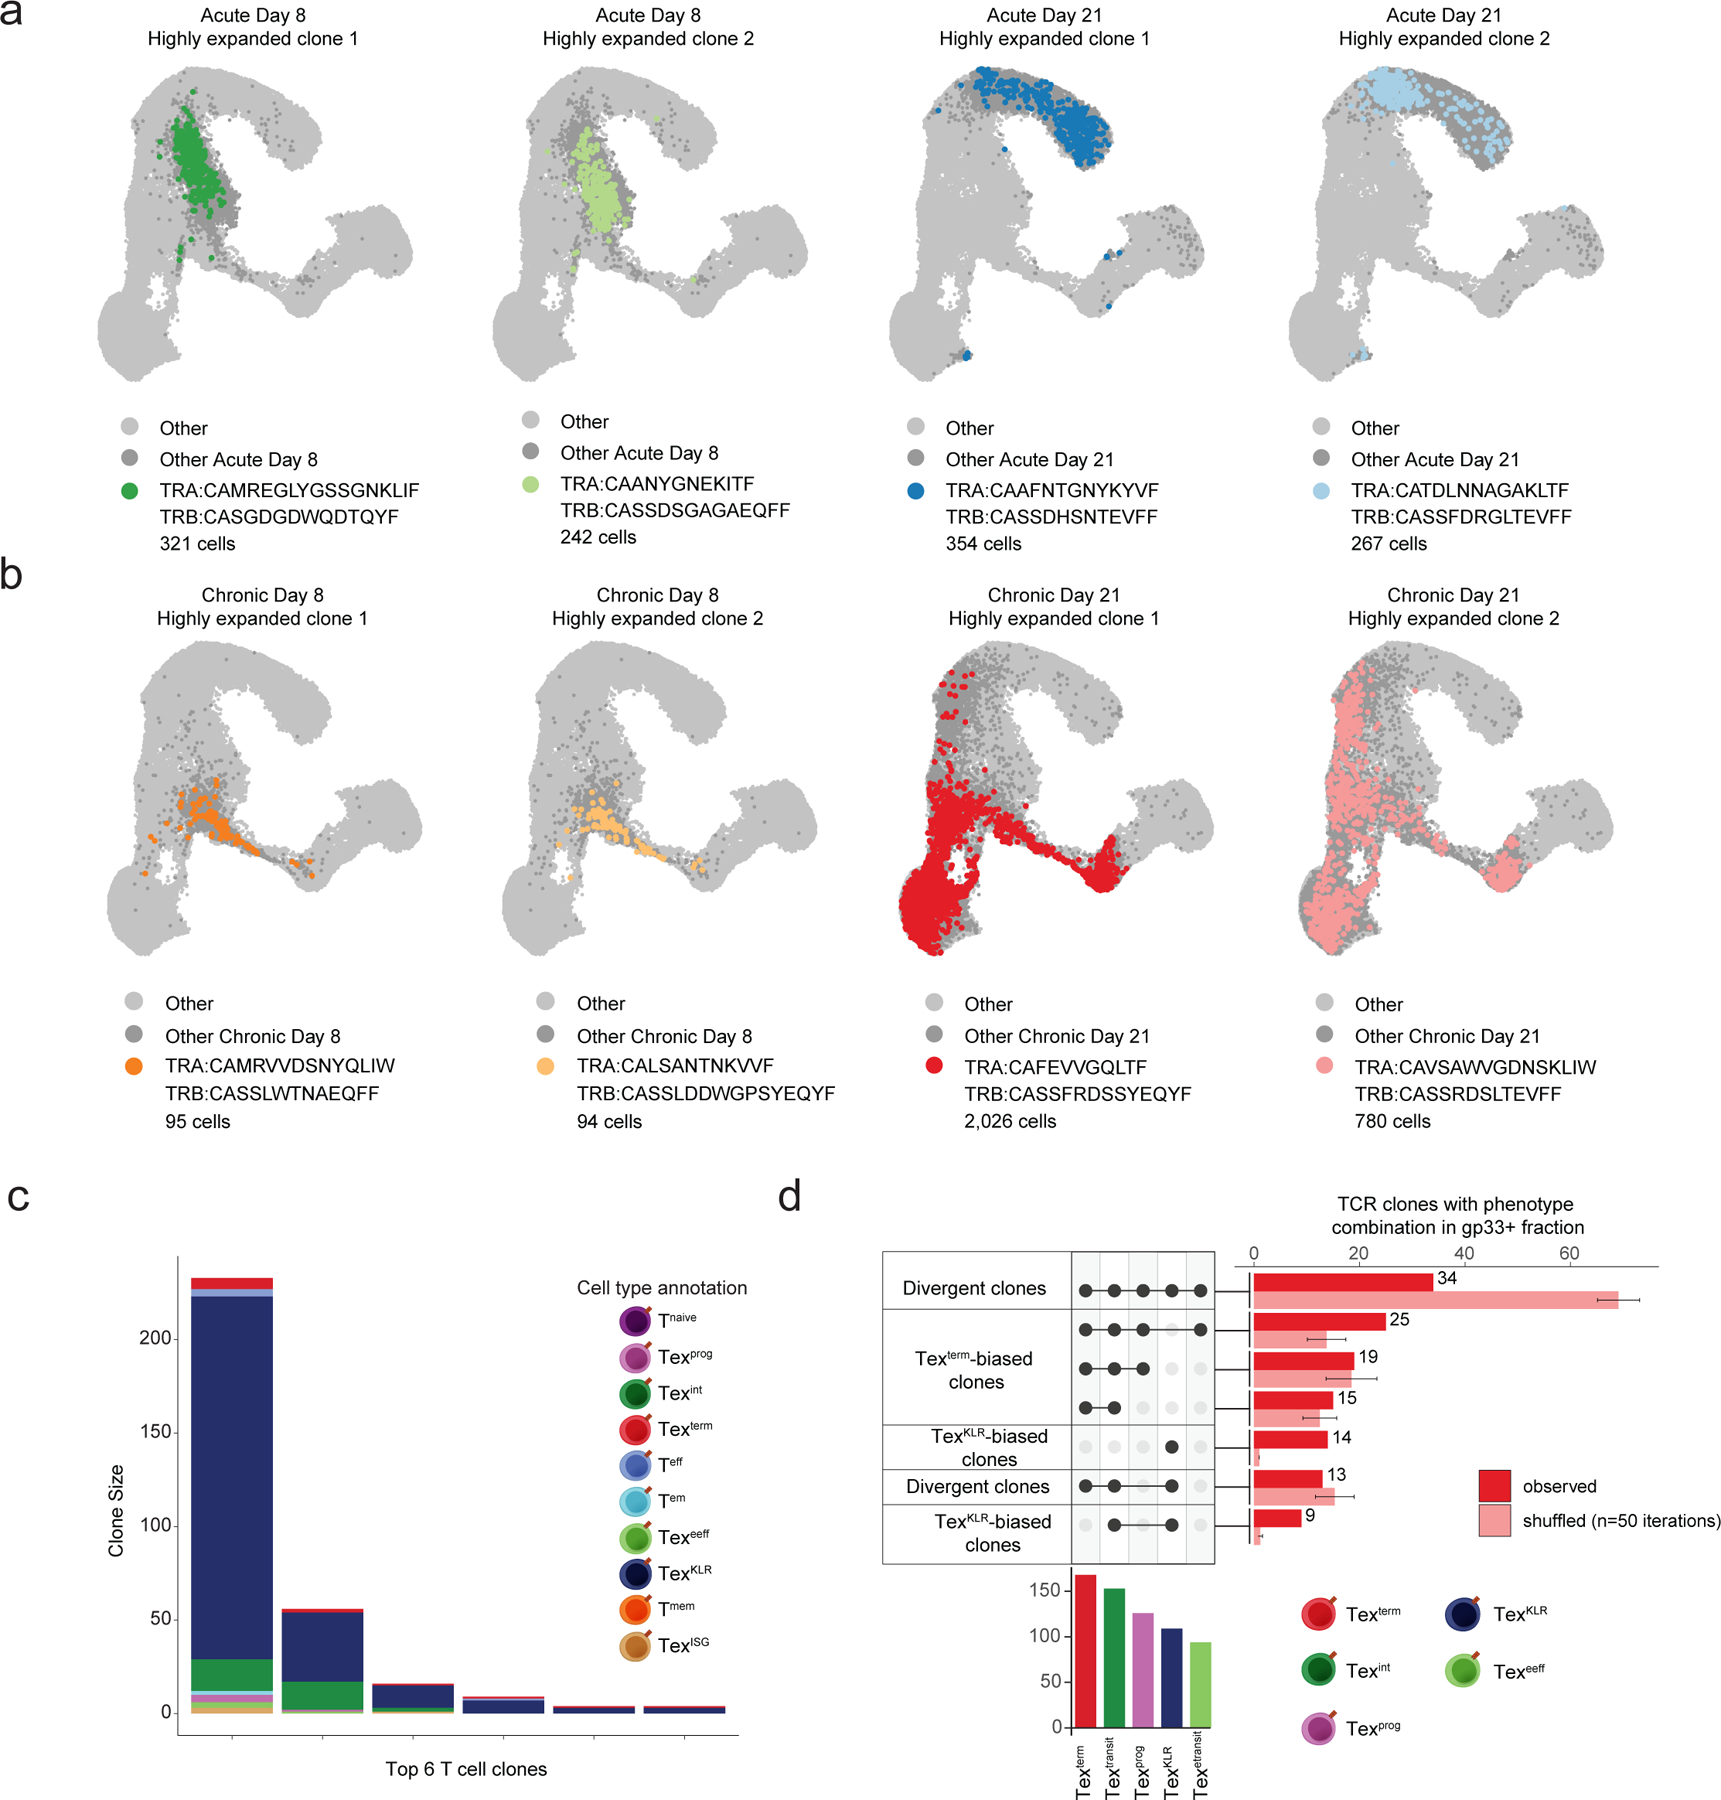
(a) UMAP of scRNA-seq results from the gp33+ and gp33− T cell fractions in the spleen at D8 and D21 of Arm and Cl13 infection. UMAP is colored by the annotated T cell subsets. (b) UMAP of scRNA-seq results of gp33+ T cells colored by the size of the detected TCR clones at D8 and D21 in the Arm infection model. (c) UMAP of scRNA-seq results of gp33+ T cells colored by the size of the detected TCR clones at D8 in the Cl13 infection model (left). Same UMAP of gp33+ T cells colored by the TCR clone size at the D21 time point in the Cl13 infection model (right). (d) UMAPs colored by the expression of the indicated gene transcripts by scRNA-seq. (e) Stacked bar plot of the phenotypic distribution of the top 10 expanded clones in the gp33+ fraction at D8 and D21 of Arm infection (left) and Cl13 infection (right). (f) Upset plot depicting the number of expanded clones with specific phenotype combinations (clone behaviors). For clarity the top 7 most common clone behaviors are shown. Barplot of the number of clones with the indicated phenotypes (bottom left). Violin plot of the clone size distribution of the detected clone behaviors (bottom right,p-values determined by two-sided Wilcoxon Rank Sum test). (g) Stacked bar plots show the top 6 expanded clones with the indicated clone behaviors. (h) UMAPs show representative examples of T cell clones with the detected clone behaviors. (i) Schematic of the phenotypic composition and the potential differentiation trajectories of the identified clone behaviors.
We visualized the distribution of phenotypes for the top 10 expanded gp33+ T cell clones at D8 and D21 in each infection. At D8 of Arm infection, almost all cells acquired the Teff phenotype. At D21, top expanded clones acquired both Tem and Tmem phenotypes, with clone sizes ranging from 77–321 (mean 153 cells, 3.8% of 4,030 total cells; Fig. 3e and Extended Data Fig. 3a). In contrast, the top expanded clones in Cl13 infection primarily acquired the Texeeff phenotype at D8, with clone sizes ranging from 26–95 cells (mean 49, 3.5% of 1,414 total cells; Fig. 3e). Analysis of D21 of Cl13 infection identified substantially larger clones, ranging from 146–2,026 cells (mean 525, 5.6% of 9,343 total cells; Fig. 3e). Strikingly, these clones contained cells with multiple Tex phenotypes, although the frequency of each phenotype varied between individual clones. Namely, individual clones either preferentially acquired the Texterm or TexKLR phenotypes or developed into both phenotypes (Fig. 3e and Extended Data Fig. 3b). We performed an analysis of the top 7 phenotypic distribution of clones (>3 cells), which revealed three main clonal differentiation patterns (clone behaviors): 1) Texterm-biased clones, consisting of cells that predominantly acquired the Texterm (46% of clones), 2) TexKLR-biased clones, consisting of T cells that predominantly acquired the TexKLR phenotype (18% of clones), and 3) divergent clones, consisting of cells that acquired Texterm and TexKLR phenotypes (36% of clones; Fig. 3f). Divergent clones were the most clonally expanded and ranged from 4–2,026 cells (mean 145) per clone, while Texterm-biased clones ranged from 4–111 cells (mean 17) per clone. Interestingly, TexKLR-biased clones were relatively small and ranged from 4–21 cells (mean 8) per clone (Fig. 3g,h). We also noted several larger clones (4–233 cells, mean 54) that skewed to the TexKLR phenotype (>50% of cells acquire the TexKLR phenotype), but had a small percentage of Texterm (Extended Data Fig. 3c). To account for sampling bias, we randomized T cell phenotype and TCR clone assignment to generate a null distribution of clone patterns, which revealed a striking enrichment of TexKLR- and Texterm-biased clone behavior over chance, whereas divergent clonal behavior was twice as likely to be detected by chance than observed in our data (Extended Data Fig. 3d). These results reveal novel divergent clonal Tex differentiation trajectories during chronic infection (Fig. 3i).
Directions of clonal Tex differentiation fates
To understand cell state transitions in Tex differentiation paths, we used dynamo to perform RNA velocity analyses35,36. This analysis demonstrated that Texeeff at D8 transition to either Texint or Texprog fates, and at D21, Texint showed a bifurcation to either TexKLR or Texterm phenotypes (Fig. 4a). Furthermore, we applied dynamo to scRNA-seq profiles from individual TCR clones; divergent clones recapitulated bifurcating Tex differentiation trajectories from Texint to either Texterm or TexKLR, accompanied by increased transcription of Texterm or TexKLR genes (Fig. 4b,c). Additionally, RNA velocity pseudotime of a divergent clone revealed a gene expression map of Tex differentiation from Texint to either terminal Tex state (Extended Data Fig. 4a). In contrast, Texterm-biased clones showed a linear RNA velocity path from Texint to Texterm, while TexKLR-biased clones primarily comprised TexKLR (Fig. 4b,c). It is important to note that this analysis summarizes the direction and magnitude of dominant local trajectories in UMAP space, rather than nominating terminal differentiation states35,36. For comparison, we performed velocity analyses in CD8+ T cells from Arm infection (Extended Data Fig. 4b).
Figure 4. Texint represent a bifurcation point of exhausted T cell fate differentiation.

(a) UMAPs of scRNA-seq results of D8 and D21 gp33+ T cells from the Cl13 infection model. UMAP is colored by the annotated T cell subsets and arrows represent Tex differentiation fate directions predicted by RNA velocity analysis. (b) UMAPs of individual Tex clones with the indicated clone behavior. Color gradient (RNA velocity pseudotime order) indicates directions of Tex differentiation fates determined by RNA velocity analysis. (c) Scatter plots of the expression level and spliced:unspliced ratio of the indicated gene transcripts in T cells of a divergent clone over pseudotime as determined by RNA velocity analysis. Expression of spliced and unspliced transcripts is derived from mean expression (first moment) of each gene calculated using k-nearest neighbors to alleviate dropout. (d) Pseudotime trajectory analyses of three potential Tex differentiation paths in scATAC-seq space (top). Heat maps of transcription factor motif deviation scores and gene integration scores (integrated scRNA-seq expression values) over the pseudotime trajectories (middle). Gene integration scores for Tox expression in the three pseudotime trajectories (bottom). (e) Schematic of adoptive transfer experiments of Texint subset (top). Pre-transfer enrichment strategy for Texint cells (middle). Stacked bar plot of the phenotypic composition of transferred T cells with all Tex subsets shown or only the CX3CR1+ subsets (bottom, n = 5 biologically independent animals). Mean % of each subset is indicated.
We used scATAC-seq data to define changes in chromatin accessibility that accompany these fate transitions (Extended Data Fig. 4c,d). Comparisons of OCRs and TF motif enrichments between Tex subsets demonstrated a high degree of similarity between Texeeff and Texprog. Similarly, Texint exhibited an intermediate chromatin state between Texterm and TexKLR states, with very few unique OCRs (Extended Data Fig. 4d). We analyzed 15,809 variable OCRs for TF motif enrichments, as well as gene integration scores, across three differentiation trajectories nominated by RNA velocity and clonal trajectories: (1) Texprog trajectory (Texeeff → Texprec [precursor exhausted Tex, an early Texprog population present at D8 in Cl13 infection] → Texprog), (2) Texterm trajectory (Texprog → Texint → Texterm), and (3) TexKLR trajectory (Texprog → Texint → TexKLR; Fig. 4d). The Texprog trajectory showed a loss of HOMEOBOX TF motifs and enrichment of BATF, AP-1, BACH, NFKB, TCF and CTCF motifs. In contrast, in both Texterm and TexKLR trajectories, we observed a loss of Texprog specific TF motifs in Texint, followed by enrichment of TF motifs that may guide the differentiation program of TexKLR (e.g., ZEB, KLF, ETS, TBX, RUNX) and Texterm (e.g., RUNX, IRF, STAT, NR4A; Fig. 4d).
Finally, we assessed the Tox locus, and found a gradual increase in accessibility during the Texeeff to Texprog transition. The Texterm trajectory demonstrated a decrease in Tox accessibility during the Texprog to Texint transition and a subsequent increase in the Texterm state (Fig. 4d). We annotated differentially accessible OCRs (compared to Tnaive) in a +/− 250kb window around the TSS and identified 88 OCRs. 16 and 8 OCRs were differentially accessible in Texeeff or Texprog, respectively, which was also supported by high Tox expression in these subsets (relative to Tnaive), indicating that TOX may initiate the molecular programming of Tex differentiation in these subsets (Extended Data Fig. 4e, Supplementary Table 9).
Early molecular programs of Tex differentiation
Next, we focused on this early stage of exhaustion by comparing D8 scATAC-seq phenotypes in Arm and Cl13 (Extended Data Fig. 5a). Memory precursor cells (Tmp) are present at D8 in Arm infection and cluster with an early Texprog population present at D8 in Cl13 infection that expresses Tox and Tcf7 (Texprec), but these subsets were relatively infrequent compared to the effector populations in both infection models and at D5 of Cl13 infection (Extended Data Fig. 5b)14,37. We compared the gene expression and chromatin state of Texprec and Tmp subsets at D8, which revealed strong exhaustion- and interferon-induced programs in Texprec (Extended Data Fig. 5c, Supplementary Table 10). Similarly, DEGs of effector populations revealed a strong Tex signature in the Texeeff subset compared to Teff; Teff showed a bona fide effector program (e.g., Gzma, Klrd1, Ccr2), while Texeeff expressed higher levels of exhaustion marker genes (e.g., Tnfrsf9, Lag3, Pdcd1, Havcr2; Extended Data Fig. 5d, Supplementary Table 11). These observations were also supported by the chromatin state programs of these subsets (Teff - 7,066 OCRs vs. Texeeff - 5,211 OCRs) that were associated with Teff-specific (ETS, RUNX) and Texeeff-specific (NFAT, BATF) TF motifs (Extended Data Fig. 5d). These results support studies demonstrating the formation of Texprec early during chronic infection that exhibit molecular signatures of exhaustion, distinct from Tmp14,37. Moreover, we find that the exhaustion program, including Tox expression, is present in the Texeeff stage, which might represent an early, heterogeneous effector pool with plasticity to seed Tex subsets. We tested this concept by adoptively transferring Texeeff, which specifically expressed Tnfrsf9 (encoding 4–1BB (Extended Data Fig. 5e). We transferred ~400,000 CD45.2+TNFRSF9+CX3CR1−SLAMF6−CD8+ T cells from D5 of Cl13 infection to CD45.1+ infection-matched hosts and analyzed the phenotypic distribution of the transferred cells. At D21, CD45.2+ cells comprised ~3.9% Texprog, ~2.5% TexKLR, ~17% Texint, and ~76% Texterm, supporting the concept that Texeeff may represent an early stage of Tex commitment (Extended Data Fig. 5f).
Differentiation of Texint to TexKLR and Texterm
Tex differentiation downstream of Texprog has been suggested to follow bifurcating differentiation paths, and the RNA velocity analysis suggested that Texint may represent the bifurcation point between TexKLR and Texterm3,9. We nominated TFs specific for each Tex phenotype based on differential RNA expression (Extended Data Fig. 5g) and Texterm- and TexKLR-specific TF motif enrichments (e.g., Texterm – NFAT, STAT, NR4A, IRF; and TexKLR – TBX, KLF; Extended Data Fig. 5h). Notably, differential analysis of Texterm and TexKLR relative to Texint identified only 4 shared OCRs, suggesting that these two cell states are epigenetically divergent. To test whether Texint could represent a bifurcation point between TexKLR and Texterm, we adoptively transferred ~200,000 CD45.2+ Texint cells (CX3CR1+SLAMF6−KLRG1−) from Cl13 infection at D21 into CD45.1+ infection-matched hosts. After 10 days, transferred Texint cells gave rise to both Texterm and TexKLR, although relatively more Texterm (Fig. 4e). To further test the potential for endogenous Texint to give rise to Texterm, we performed genetic fate-mapping using Cx3cr1CreERRosa26LSL-tdT mice that can trace the fate of Cx3cr1-expressing cells. Short-term fate mapping of Cx3cr1-expressing cells (which includes both TexKLR and Texint cells) at D22 in Cl13 demonstrated that by D25, 6.5% of Texterm cells were labeled with tdTomato, supporting the concept that Texint cells can give rise to Texterm (Extended Data Fig. 5i). These results support the concept that the Texint stage is a bifurcation point of Tex differentiation; however, it is important to note two caveats: (1) the genetic fate-mapping results do not inform the overall contribution of Texint to TexKLR, and it is possible that TexKLR also arise from a Texint-independent path, which is also supported by our TCR clone analysis, and (2) we cannot rule out the possibility that Texterm are generated directly from Texprog in some settings.
Tex clone behaviors are shared across tissues
We next asked if clonal differentiation patterns are intrinsically programmed. We first determined whether expanded Tex clones could be found across organs (animal-matched) in Cl13 at D21 (Fig. 5a). In spleen-, liver-, and lung-derived scRNA/TCR-seq datasets, we detected expanded T cell clones across all three tissues, and the gp33+ and gp33− fractions showed minimal TCR overlap (Fig. 5b and Extended Data Fig. 6a). Importantly, there was significant TCR sharing across the different organs within both gp33+ and gp33− fractions (Extended Data Fig. 6a). We identified expanded organ-shared T cell clones that had at least 5 T cells, which consisted of at least 1 cell from each organ. This analysis identified 100 shared T cell clones among all organs, 37 clones shared between the lung and spleen, and 22 spleen-specific clones (Fig. 5c,d).
Figure 5. Conserved clonal T cell trajectories across organs and depletion of TexKLR in the liver microenvironment.

(a) UMAP of organ-derived T cells at D21 in Cl13 infection colored by the annotated T cell subsets. (b) UMAPs colored by the detected TCR clone sizes in the different organs. (c) Scatterplots comparing the frequencies of expanded T cell clones from the indicated organs. The correlation coefficient (Pearson’s R), and specific and shared clone numbers are indicated for each comparison. (d) Venn diagram depicting the overlap of expanded T cell clones in the gp33+ fraction of the indicated organs. (e) Stacked bar plot of the phenotypic composition of individual clones across organs. (f) UMAPs of individual clones with specific clone behaviors across organs. (g) Scatter plots comparing the fraction of cells in individual clones with TexKLR and Texterm phenotypes between the indicated organs. Correlation coefficient calculated using Pearson’s R and p-value determined using a two-sided t-distribution with n-2 degrees of freedom. Shaded area represents 95% confidence interval of linear model. (h) Violin plot of TexKLR-biased clone frequencies across the organs, defined as clones with >50% TexKLR phenotype in the spleen (left). Violin plot of Texterm-biased and divergent clone frequencies across the organs (right; n = number of scRNA-seq profiles; box center line, median; box limits, upper and lower quartiles; box whiskers, 1.5× interquartile range). P-values determined by two-sided Wilcoxon Rank Sum test.
Next, we examined the phenotypic distribution of organ-shared clones (Fig. 5e,f and Extended Data Fig. 6b,c). First, we focused on comparisons between the spleen and lung and found highly conserved clone behaviors. Divergent clones in the spleen also maintained Texterm and TexKLR phenotypes in the lung (although instead exhibiting the Texlung phenotype; 35/48 divergent clones detected in both organs, Fig. 5e,f, and Extended Data Fig. 6b,c). Similarly, the majority of splenic TexKLR-biased clones (4/7 clones) and Texterm-biased clones (11/14 clones) maintained their behavior in the lung (Fig. 5e and Extended Data Fig. 6c). In particular, we did not observe appreciable interconversion between TexKLR- and Texterm-biased clones between these two organs (0/19 shared clones). Accordingly, quantification of TexKLR and Texterm frequencies within individual clones showed a high concordance across organs (Fig. 5g). These results demonstrate that Tex clones are shared across organs and that clonal differentiation behavior is primarily intrinsically programmed.
Depletion of TexKLR clones in the liver microenvironment
We next analyzed clonal behavior in the liver, which showed an overall enrichment of Texterm, compared to other organs (94% Texterm). Thus, we expected an enrichment in clonal Texterm frequency; however, this could be driven by a depletion of TexKLR-biased clones and/or interconversion of TexKLR-biased or divergent clones to Texterm-biased clones. We first analyzed the TexKLR-biased clones from the spleen and found that only one of these clones was present in the liver (1/7 clones), suggesting that TexKLR-biased clones are depleted in the liver niche (Extended Data Fig 6c). Similarly, although divergent clones were largely detectable in the liver (52/58 clones shared between spleen and liver), we again observed a depletion of TexKLR cells, resulting in Texterm-biased behavior in the majority of the cases (32/52 shared clones) (Extended Data Fig 6c). In contrast, the majority of Texterm-biased clones remained Texterm-biased in the liver, although they were heavily skewed towards Texterm, with relative loss of Texprog and Texint (9/9 clones, Fig. 5e,f and Extended Data Fig 6c). Quantification of frequencies of TexKLR and Texterm phenotypes of shared clones in the spleen and liver confirmed the depletion of TexKLR in the liver and a skewing of Texterm-biased clones to the Texterm fate (Fig. 5g,h).
To investigate differences in viral antigen levels in the three organ niches, we measured LCMV glycoprotein viral transcripts (LCMV-gp), which showed that LCMV-gp transcripts were higher in the lung and liver, compared to the spleen (Extended Data Fig. 6d). However, LCMV-gp transcripts were the highest in the lung, suggesting that additional microenvironment differences may underlie the depletion of TexKLR from the liver. Since IL-21 has been shown to be a critical cytokine supporting the maintenance of CX3CR1+ Tex cells, we also measured Il21 levels in each organ9,13. We found significantly lower Il21 levels in the liver, compared to the spleen and lung, suggesting that a lack of IL-21 may contribute to TexKLR depletion (Extended Data Fig. 6d).
TCR signaling avidity correlates with clone behavior
The difference in clonal expansion between Texterm-biased clones and TexKLR-biased clones led us to examine whether Tex differentiation trajectories correlate with differences in TCR signaling avidity. We first used tetramer binding level as a proxy for TCR avidity and sorted gp33− (n=8,914), gp33-intermediate (gp33int; n=5,875), and gp33-high (gp33high; n=8,194) splenic CD8+ T cells from Cl13-infected mice at D21 and performed scRNA/TCR-seq (Fig. 6a; Extended Data Fig. 7a). Analysis of TCR sequences identified 313 TCR clonotypes in gp33high cells, 1,576 in gp33int cells, and 3,803 in gp33− cells (Extended Data Fig. 7b). The TCR repertoire showed a small overlap between gp33high and gp33− cells (13 shared TCRs), compared to the overlap between gp33high and gp33int cells (158 shared TCRs), or gp33int and gp33− cells (306 shared TCRs), and TCR repertoire similarity analysis demonstrated that gp33int sorting captured a unique repertoire (Extended Data Fig. 7b,c).
Figure 6. Clonal differentiation of TexKLR and Texterm correlates with TCR signaling avidity.

(a) Sorting strategy to obtain gp33−, gp33int and gp33high CD8+ T cell populations from the spleen of LCMV-Cl13 infected animals 21-days following infection. (b) Venn diagram of the overlap of expanded clones from the gp33 T cell fractions. (c) UMAPs colored by size of the unique expanded clones in the three gp33 T cell fractions. (d) Stacked bar plot of the top 10 uniquely expanded T cell clones from gp33 T cell fractions colored by T cell phenotype. (e) Upset plots of phenotype combinations (clone behavior) in unique expanded clones from the three gp33 T cell fractions. For clarity the top 7 most common clone behaviors are shown. Bar plots show the number of clones with the indicated phenotypes. Dominant clone behaviors are indicated at the bottom. (f) Dose response curves of gp33 peptide stimulation of the indicated TCRs in an NFAT-GFP reporter T cell hybridoma cell line. TCRs were selected from gp33high (divergent clones) and gp33int (TexKLR-biased clones) fractions. Peptide concentration that triggers half of the maximum signaling avidity is indicated based on % of GFP+ cells (log10EC50 values). Clone size and phenotype distribution of each clone is shown as a stacked bar plot. Bar plot shows normalized (to TCR expression) % of GFP+ cells (Norm. reporter activity) for all TCRs stimulated with a constant peptide concentration (100nM, bottom left). P14 LCMV-specific TCR was used as a positive control and OT-1 TCR (ovalbumin peptide specific) as a negative control. The mean of two technical replicates are shown of a representative experiment out of three independent experiments which all showed the same results.
Next, we evaluated the clone size distribution of the sorted populations, which revealed an increase in the percentage of large clones (clones with 5–200 or >200 cells) as a function of higher tetramer binding (fluorescence), with an accompanying decrease in clonal diversity (Extended Data Fig. 7d). To link unique TCR clones to each gp33-tetramer fraction, we compared the overlap of clones between gp33 fractions and identified 592 unique gp33− clones, 114 unique gp33int clones, and 88 unique gp33high clones (Fig. 6b,c). Importantly, we found phenotypic skewing in the unique clones (Fig. 6c; Extended Data Fig. 7e,f). Namely, gp33high cells contained ~3.3 times more cells with Texterm and Texint phenotypes, compared to either gp33− or gp33int cells (39% Texterm, 19% Texint in gp33high; 11% Texterm, 6.7% Texint in gp33int; 11% Texterm, 7.0% Texint in gp33−). In contrast, gp33int cells exhibited phenotypic skewing towards the TexKLR phenotype, compared to gp33high and gp33− cells (27% TexKLR in gp33int; 7.9% TexKLR in gp33high; 13% TexKLR in gp33−; Fig. 6d; Extended Data Fig. 7e). We validated differences in Tex phenotype distribution and function across gp33 fractions using flow cytometry (Extended Data Fig. 7g,h).
To analyze differentiation trajectories, we visualized the top 10 unique expanded clones in each gp33-tetramer fraction and assessed their phenotypic composition. We found that the top clones in the gp33− and gp33high fractions were biased towards Texterm or divergent phenotypes (10/10 gp33− clones and 10/10 gp33high clones; expanded gp33− clones likely represent other antigen specificities), while the largest clones in the gp33int pool exhibited skewing towards the TexKLR phenotype (5/10 gp33int clones; Fig. 6d). We analyzed the top 7 clone behaviors of the three gp33 fractions, which demonstrated that clones from the gp33− fraction primarily exhibited Texterm-biased and TexKLR-biased behaviors, clones from the gp33int fraction were heavily enriched for TexKLR-biased differentiation, and clones from the gp33high fraction were biased towards Texterm-biased and divergent clone behaviors, and lacked TexKLR-biased clones (Fig. 6e).
Finally, we tested TCR signaling avidity of unique TCR clonotypes from gp33high and gp33int fractions (top 3 TCRs derived from divergent and TexKLR-biased clones). We computationally assembled full-length TCRα and TCRβ sequences from scRNA/TCR-seq data (Extended Data Fig. 7i; Supplementary Table 12), cloned, and virally transduced into an NFAT-GFP reporter cell line. We also cloned the P14 TCR (positive control; high-affinity gp33-specific TCR) and an OT-1 TCR recognizing Ovalbumin (negative control). We co-cultured each T cell hybridoma TCR line with increasing concentrations of gp33 peptide-pulsed splenocytes and measured GFP expression as an indicator of downstream of TCR signaling. These studies supported two concepts: (1) TCRs from the gp33int and gp33high fractions induced GFP expression after co-culture with gp33 peptide, confirming gp33-reactivity, and (2) divergent TCRs from the gp33high fraction exhibited higher signaling avidities (mean EC50=8.4nM; positive control P14 – 50nM), compared to TexKLR clones from the gp33int fraction (mean EC50=3,200nM; Fig. 6f). These results indicate that divergent/gp33high TCRs exhibit ~400x higher signaling avidity than TexKLR/gp33int TCRs, supporting a role for TCR signal strength in driving divergent Tex trajectories.
Human TILs show conserved Tex clone behavior
We analyzed tumor infiltrating lymphocytes (TIL) to investigate whether Tex clone behaviors are conserved in human cancer. We reanalyzed a dataset of 109,089 CD8+ T cells profiled by scRNA/TCR-seq from 47 patients spanning 10 cancer types, which were previously categorized as 7 subsets: 1) Tnaive, 2) effector memory (Tem), 3) tissue-resident memory (Trm); 4) TCF7+ exhausted (TexTCF7+); 5) NME1+ memory-like (TmNME1+), 6) terminally exhausted (Texterm), and 7) CX3CR1+ terminally differentiated effector memory (TemraCX3CR1+; Fig. 7a)38. We scored each TIL subset for enrichment of gene signatures from Tex subsets in Cl13 infection and found a concordance between murine and human T cell types. Namely, the murine Texterm gene signature was highly enriched in human Texterm, the TexKLR gene signature was highly enriched in human TemraCX3CR1+, the Texint and Texeeff gene signatures were enriched in TmNME1+, and the Texprog gene signature was enriched in TexTCF7+ (Fig. 7b-d).
Figure 7. Human TILs exhibit shared Tex transcriptional programs and divergent clonal differentiation trajectories.

(a) UMAP of TILs profiled by scRNA-seq from Zheng et al., 2021, colored by T cell phenotypes. (b) UMAPs colored by the indicated LCMV Cl13 Tex gene signature scores (top). Violin plots of LCMV Cl13 Tex gene signature scores across human TIL clusters (bottom, box center line, median; box limits, upper and lower quartiles; box whiskers, 1.5× interquartile range). For each violin plot, n = number of scRNA-seq profiles: Tnaive = 6,879; Tem = 37,057; Trm = 18,348; TexTCF7+ = 757; TmNME1+ = 593; Texterm = 13,024; TemraCX3CR1+ = 11,702. (c) Violin plots of additional LCMV Cl13 Tex gene signature scores across human TIL clusters (box center line, median; box limits, upper and lower quartiles; box whiskers, 1.5× interquartile range). Human TIL clusters are ranked in decreasing order with cluster with highest enrichment of LCMV Cl13 Tex gene signature score on the left. For each violin plot, cell numbers are same as (b). (d) Schematic of the relationships found between human TIL subsets and mouse LCMV-reactive (gp33+) Tex subsets. (e) Stacked bar plots of the phenotype distribution of top 10 human expanded TIL clones for the indicated clone behaviors that were detected among LCMV-reactive mouse T cells.
Finally, we analyzed the phenotypic distribution of expanded TIL clones (n=729) and found that most clones exhibited Texterm-biased behavior (n=483), which comprised TexTCF7+, Tem, Trm, and Texterm (Extended Data Fig. 8a,b). In addition, we detected TemraCX3CR1+-biased clones (n=225), which primarily comprised cells with a TexKLR-like phenotype (Supplementary Fig. 8a,b). Finally, we also observed TIL clones with divergent behavior, comprising Texterm and TemraCX3CR1+ (n=24 clones; Extended Data Fig. 8a,b). Analyzing the top 10 clones with each behavior demonstrated that apart from a few large TemraCX3CR1+-biased clones, clone sizes were similar between Texterm and TemraCX3CR1+ clones, and smaller in divergent clones (Fig. 7e). Altogether, these results demonstrate similarities in gene expression signatures of human CD8+ TIL and LCMV-reactive murine Tex subsets, and that human TIL clones can exhibit divergent, TexKLR-biased, and Texterm-biased differentiation paths analogous to those observed in Cl13 infection.
Discussion
Here we report a single-cell multi-omic atlas of T cell exhaustion during chronic viral infection, which reveals new Tex subsets and their molecular programs, identifies multiple differentiation trajectories of Tex clones, and nominates TCR signal strength as a driver of clonal behavior. Prior studies have described multiple Tex subsets with distinct phenotypic and functional traits, including CX3CR1+ transitory exhausted cells8,9,13. Here we show that this CX3CR1+ population encompasses two Tex subsets with distinct functionalities: 1) Texint, which represent a bifurcation point in Tex differentiation to either Texterm or TexKLR, and 2) TexKLR with superior functionality and proliferative capacity, compared to Texint and Texterm. This heterogeneity may help to explain prior discrepancies in understanding the lineage potential and differentiation path of CX3CR1+ Tex cells8,9,15. Notably, the development of TexKLR occurs via two distinct clonal differentiation paths (TexKLR-biased and divergent clones), and future studies are needed to understand whether clonally unrelated TexKLR cells possess distinct functional characteristics.
Given the stable epigenetic state of Tex22,39, it is important to understand the stage at which the Tex epigenetic program is initiated. Previous studies demonstrated that early TCF1+ Texprec cells possess the epigenetic signature of Tex and can seed additional Tex subsets14,37. Here, we find that the Tex program is initiated at an earlier stage in Texeeff. scATAC-seq analysis and adoptive transfer experiments suggest that this fate decision may be driven by NFAT and BATF, followed by subsequent activation of BACH2 and TCF-1 to give rise to Texprec/Texprog14,18. These findings, coupled with early clonal expansion of Texeeff, support a model in which the Texprec and Texprog pool originates from Texeeff. However, it is important to note that our results do not exclude the possibility that Texprog can also differentiate to Texeeff. Future lineage tracing experiments will further clarify the relationship between these early Tex cell types.
Downstream of Texprog, the differentiation trajectory of Tex has largely been thought to follow a linear path, although some studies have suggested a bifurcating path3,9. Our data identifies two late-stage Tex types (TexKLR and Texterm), and that individual clones can follow three differentiation trajectories resulting in Texterm-biased, TexKLR-biased, or divergent fates, comprising both cell types. Furthermore, we find that the differentiation trajectory of Tex clones correlates with TCR signaling avidity and thus seems to be programmed by the TCR and conserved across different tissues. However, additional paths to induce TCR signal strength variation – for example, via inhibitory receptor signaling, access to antigen, cytokines, or other factors – may also promote the development of the TexKLR phenotype. Importantly, TexKLR-biased clones were depleted in the liver microenvironment, suggesting that these clones are unable to persist in the liver, while Texterm were able to persist. Given the high viral load and inflammatory microenvironment of the liver during infection, these results suggest that the Texterm phenotype may improve Tex persistence and preserve anti-viral effector function in specific organ systems40.
Finally, these findings may have several implications for cancer. First, several ongoing therapeutic strategies aim to reverse exhaustion; however, our results suggest that Texterm may be specifically adapted to survive in high antigen niches4,16,17,19–21,41. Whether the pro-survival aspects of T cell exhaustion can be maintained while reinvigorating effector function will require further study. Second, our findings reinforce the notion that TCR signal strength can direct the fate of T cells42,43. Thus, the generation of TCR-based cellular therapies should assess the phenotypic outcomes of TCR activation, in addition to antigen recognition. Finally, the observation that a polyclonal T cell response to chronic antigen balances persistence, effector, and potential memory functions via the development of two Tex states suggests that future cellular therapies may wish to establish divergent phenotypes44. Indeed, a recent study identified a natural killer (NK) cell-like signature in exhausted human chimeric antigen receptor (CAR)-T cells, which resembles the TexKLR signature, suggesting that this cell type may be present in adoptive cell therapy settings as well45. Manipulation of these features and gene regulatory programs of the Tex state may provide important avenues for improved T cell-based immunotherapies.
Methods:
Mice and infection
Male C57BL/6J (CD45.2) and B6.SJL-Ptprca Pepcb/BoyJ (CD45.1) mice were purchased from Charles River Laboratories or The Jackson Laboratories. All mice were housed in a specific pathogen-free facility and were used for infection at 8–12 week of age. Mice were housed in a 12 light/12dark cycle, and temperature was kept in between 65–75F with 50% humidity. LCMV infection was performed essentially as described previously46. All experiments were performed according to protocols approved by Stanford University’s (protocol number: 33814) and Washington University’s (protocol number: 21–0244) Institutional Animal Care and Use Committee.
Tissue preparation
Single cell suspension of the different organs was prepared by manual dissociation. Organs were minced and gently pushed through a 40-micron strainer. Spleen single cell suspensions were spun, and red blood cells were lysed with ACK-lysis buffer by resuspending the cell pellet followed by 2 minutes incubation. Cells were then washed with ice-cold PBS and stained for sorting in FACS buffer (PBS, 0.1% BSA, 2mM EDTA, 5% FBS). For the lung and liver single-cell suspension, organs were cut into small pieces and gently pushed through a 40-micron diameter strainer. Single-cell suspensions were then layered on top of Ficoll-Paque Plus (Cytiva) and centrifuged according to the manufacturer’s recommendations. The lymphocyte fraction was collected and washed with ice-cold PBS, and then stained for sorting.
RNA isolation and viral transcript determination
Approximately 10mg of spleen, liver and lung pieces were cut and tissues were flash frozen on dry-ice followed by the addition of 750ul Trizol and smashed with a plastic pestle, which was further homogenized with a 25-gauge needle. From this tissue homogenate, 375ul was use and further diluted with 125 ul Trizol. This mixture was mixed with 100ul chloroform, and were spun at maximum speed at 4 °C. RNA was precipitated from the aqueous phase with isopropanol, followed by centrifugation and 70% ethanol wash of the RNA pellet. 500ng RNA was used for reverse transcription (Qscript), and quantitative real-time PCR (SYBR green) was performed with the following primers: LCMV-gp forward primer: CATTCACCTGGACTTTGTCAGACTC; LCMV-gp_reverse primer: GCAACTGCTGTGTTCCCGAAAC; Il21 forward primer: TCATCATTGACCTCGTGGCCC; Il21 reverse primer: ATCGTACTTCTCCACTTGCAATCCC. Gene expression was normalized to the expression of the Hprt housekeeping gene: Hprt forward primer: AGGTTGCAAGCTTGCTGGT; Hprt reverse primer: TGAAGTACTCATTATAGTCAAGGGCA.
Staining T cells for sorting and analysis
Single cell suspensions were stained with the following antibodies: CD8b (BioLegend Cat# 126610; conjugated with PerCP-Cy5.5, dilution – 1:800), CD4 (BioLegend Cat#100414; conjugated with APC-Cy7, dilution – 1:400), PD-1 (BioLegend Cat# 135216; conjugated with PE-Cy7, dilution – 1:200), CX3CR1 (BioLegend Cat# 149008; conjugated with APC, dilution – 1:400), SLAMF6 (BD Biosciences Cat# 745250; conjugated with BV605, dilution – 1:100), CXCR6 (BioLegend Cat# 151119; conjugated with PE-Cy7 or APC-Cy7, dilution – 1:200), TNFRSF9 (BioLegend Cat# 106105; conjugated with PE, dilution – 1:200), KLRG1 (BioLegend Cat# 138413; conjugated with BV421, dilution – 1:200) and the class I tetramer, H-2Db LCMV gp33–41 (KAVYNFATC) (PE conjugated, dilution – 1:100). Cells were stained with the tetramer for 20 minutes at 4C followed by staining with the combination of the other antibodies for 20 minutes. Cells were washed in FACS buffer and stained with LIVE/DEAD Fixable Aqua dead cell stain for 20 minutes in PBS. Intracellular staining was performed with the Foxp3 intracellular staining kit (eBioscience) according to manufacturer’s protocol with the following antibodies: MKI67 (BioLegend Cat# 652410; conjugated with FITC or PerCP-Cy5.5, dilution – 1:200), IFNG (BioLegend Cat# 505806; conjugated with FITC, dilution – 1:200), and LAMP-1 (BioLegend Cat# 121624; conjugated with PE-Dazzle 594, dilution – 1:200). Flow cytometry analysis and cell sorting were performed by BD FACSAria III (BD Biosciences) using BD FACSDiva Software 6.0 (BD Biosciences). Flow cytometry data were analyzed with FlowJo v10 (FlowJo; BD Biosciences).
Adoptive transfers
Adoptive transfer experiments were performed by transferring early effector exhausted T cells (Texeeff, CD8+ TNFRSF9+, SLAMF6−, CX3CR1−) T cells into infection-matched CD45.1 host. Approximately 4×10⁵ cells were transferred from D5 following Cl13 infection into infection-matched hosts (n=3). Transferred cells (CD45.2+) were analyzed at D21 following Cl13 infection. Due to this stringent sorting strategy that excludes Texint, TexKLR and Texprog from the transferred cell pool, the Texeeff population comprised 8.7% of total CD8+ CX3CR1− SLAMF6− fraction at D5, which represents a smaller fraction of total Texeeff than would be expected from the scRNA-seq results (52.36% of the gp33+ fraction was Texeeff). This may also be in part due to inaccuracies in scRNA-seq cluster-based cell classification. Intermediate exhausted T cells (Texint, CD8+, CX3CR1+, KLRG1−, SLAMF6−) were isolated from D21 following Cl13 infection and transferred into infection-matched CD45.1 host (n=5). Approximately 2×10⁵ cells were transferred from D21 and transferred, CD45.2+ Tex subsets were analyzed at D31. Tex subsets were identified by the following markers: Texint – CX3CR1+, SLAMF6−, KLRG1−; Texprog – SLAMF6+, CX3CR1−; TexKLR – CX3CR1+, KLRG1+, SLAMF6−, Texterm – CX3CR1−, SLAMF6−. We would like to emphasize that while both Texeeff and Texterm were defined as CX3CR1− SLAMF6−, the double negative fraction at D21 post Cl13 infection contained ~1% Texeeff cells based on scRNA-seq (Extended Data Fig. 1b – scRNA-seq UMAP) 1; therefore, additional gating for Texterm cells was not performed in the Texint transfer experiment. Flow cytometry analysis and cell sorting were performed by BD FACSAria III (BD Biosciences) using BD FACSDiva Software 6.0 (BD Biosciences). Flow cytometry data were analyzed with FlowJo v10 (FlowJo; BD Biosciences).
scATAC-seq sample and library generation
Single cell ATAC-seq experiments were performed on the 10x Chromium platform as described earlier47. Briefly, after sorting, T cells were washed with PBS + 0.04% BSA and then subjected to nuclei isolation according to the protocol of the manufacturer. Nuclei were counted and on average ~10,000 nuclei were submitted for tagmentation. After tagmentation, nuclei were loaded for capture using the 10x Chromium controller. After Gel emulsion generation, linear amplification was performed, followed by DNA purification according to the manufacturer’s protocol. The resulting DNA was used for library construction as described on the website of the manufacturer. Libraries were quantified by Agilent Bioanalyzer and were sequenced on an Illumina NovaSeq S4 sequencer, using the following setup: 50bp read 1N, 8bp i7 index, 16bp i5 index and 50bp read 2N. In this reaction, 1N and 2N refers to the DNA insert sequencing, while i5 and i7 sequencing identifies the individual barcodes of single cells.
Single-cell RNA-seq library preparation
Single-cell RNA-seq libraries were prepared using the 10X 5’ Single Cell Immune Profiling Solution Kit (v1.1 Chemistry), according to the manufacturer’s instructions. Briefly, FACS sorted cells were washed once with PBS + 0.04% BSA and on average 10,000 cells were submitted for capture using the 10x Chromium controller. Following reverse transcription and cell barcoding in droplets, emulsions were broken, and cDNA was purified using Dynabeads MyOne SILANE followed by PCR amplification (98°C for 45 sec; 14 cycles of 98°C for 20 sec, 67°C for 30 sec, 72°C for 1 min; 72°C for 1 min). For gene expression library construction, 50 ng of amplified cDNA was fragmented, end-repaired, and double-sided size selected with SPRIselect beads. Purified DNA was subjected to PCR amplification with sample indexing primers (98°C for 45 sec; 14 cycles of 98°C for 20 sec, 54°C for 30 sec, 72°C for 20 sec; 72°C for 1 min). Amplified DNA was double-sided size selected with SPRIselect beads and were quantified using Agilent Bioanalyzer. Single-cell RNA-seq libraries were sequenced on an Illumina NovaSeq S4 sequencer using the following read configuration 26bp Read1, 8bp i7 Index, 91bp Read2.
Single-cell TCR library generation
Single-cell TCR libraries were prepared with the 10x Chromium Single Cell V(D)J Enrichment Kit for mouse T cells (v1.1 Chemistry) following the manufacturer’s protocol. Briefly, after cDNA amplification and clean up, 2ul of cDNA was used for target enrichment. First, target enrichment 1 was performed by specific primers followed by a SPRIselect bead clean-up. Second, target enrichment 2 was performed with specific primers followed by double-sided size selection with SPRIselect beads. After the two target enrichment steps, the quality of the product was assessed with Agilent Bioanalyzer. Amplified product was then subjected for fragmentation, followed by end repair and A-tailing. End repaired product was then subjected to adaptor ligation followed by SPRIselect bead purification. Product was amplified and barcoded with adaptor specific primers and the quality of the resulting libraries were determined by Agilent Bioanalyzer. Single-cell TCR-seq libraries were sequenced on an Illumina NovaSeq S4 sequencer using the following read configuration 26bp Read1, 8bp i7 Index, 91bp Read2.
In vitro assessment of TCR signaling avidity
Sequences of CDR3 variable regions and VDJ gene annotations of paired Tcra/Tcrb expressed in gp33high and gp33int cells were extracted from the single cell sequencing data48. Full length TCR sequences were assembled by www.imgt.org and confirmed using TRUST4. The P14-TCR sequence was obtained from GenBank (accession numbers: X06772 and X06771). Each Vb-TRBC2-(GSG linker)-T2A-Va sequence was synthesized with 5’ linker (5’-AGGCGCCGGAATTAGATCTCTCGAGCCACC-3’) and 3’ linker (5’-GCAGAGGGTGCTGTCCTGAGACCGAGGATC-3’) sequences (Twist Biosciences) and cloned into XhoI and BamHI sites of the MSCV-based retroviral plasmid MigCaRCh that contains a TRAC IRES mCherry sequence downstream of the cloning sites (a gift from Chyi-Song Hsieh, Washington University) using an NEB HiFi assembly kit. Each paired Tcra/Tcrb was retrovirally expressed in 58a–b– NFAT-GFP reporter cells49,50 (Thy1.1+, a gift from Kenneth Murphy, Washington University) that had been engineered to express Cd8a/b and sorted based on expression of CD8a/b, mCherry and TCRb. 2.5 × 10⁴ cells of each hybridoma were stimulated with 5 × 10⁵ irradiated C57BL/6 splenocytes (3,000 rad) in the presence of varying concentrations of LCMV-gp33 peptide (Genscript) for 40-hours in RPMI 1640 media supplemented with 10% fetal bovine serum and 50 uM of 2-mercaptoethanol, and frequencies of GFP+ cells in Thy1.1+ cells were measured by flow cytometry using an Attune flow cytometer.
Cx3cr1-creER-mediated fate mapping
Lineage tracing of Cx3cr1-expressing cells was performed as described previously13. Briefly, Cx3cr1-creERT2 mice were crossed to Rosa26-CAG-loxP-stop-loxP-tdTomato reporter mice and infected with LCMV-Cl13. Infected mice were treated with 1 mg of tamoxifen (Sigma) dissolved in corn oil (Sigma) by oral gavage on 22 dpi (days post infection), followed by analysis of tdTomato expression in LCMV-gp33-specific CD8 T cells on 25 dpi.
scATAC-seq data processing and analysis
scATAC-seq datasets were processed as described previously51. Briefly, reads were filtered, trimmed, and aligned to the mm10 reference genome using 10X Genomics’ cellranger-atac count pipeline (version 1.2.0).
Processed fragment files were loaded into ArchR (version 1.0.1) for additional processing and analysis. All functions used default parameters unless otherwise specified. Cells were filtered during Arrow file generation using ArchR’s createArrowFiles function to remove cells with an enrichment of Tn5 insertions in transcription start sites (TSS enrichment) of less than 4 or less than 1000 unique fragments. Doublets were identified using ArchR’s addDoubletScores function and predicted doublets removed using ArchR’s filterDoublets function. Dimensionality reduction was performed using Iterative Latent Semantic Indexing (LSI) using ArchR’s addIterativeLSI function. After initial clustering and UMAP projection, we excluded a small cluster of non-T cells. Cell clustering was performed using ArchR’s addClusters function on IterativeLSI reduced dimensions 1:10 and a resolution of 0.4 (reducedDims = “IterativeLSI”, dimsToUse = 1:10, resolution = 0.4). The same dimensions were used for single cell embedding by Uniform Manifold Approximation and Projection (UMAP) using ArchR’s addUMAP function using IterativeLSI reduced dimensions 1:10 and a minimum distance of 0.1 (reducedDims = “IterativeLSI”, dimsToUse = 1:10, minDist = 0.1). Cell clustering and UMAP projection for Chronic LCMV (D8 and D14, Figure 3) and Day 8 (Chronic and Acute, Figure S3B) subsets were performed as described above with the following modifications: dimsToUse = NULL, resolution = 0.2, and minDist = 0.4.
GeneScore matrices were computed by summing Tn5 insertions in the gene promoter and gene body during Arrow file generation using ArchR’s createArrowFiles function51. Gene score imputation was performed with Magic using ArchR’s addImputeWeights function52. After clustering the cells, peaks were called by MACS2 on pseudoreplicates sampled from each cluster to obtain a reproducible peak set retaining cell type specific peaks using ArchR’s addReproduciblePeakSet function. Peak co-accessibility and Peak2Gene linkages were computed using ArchR’s addCoAccessibility and addPeak2GeneLinks functions. Transcription factor (TF) motif deviations were computed with chromVar using ArchR’s addDeviationsMatrix function25. Pseudo-bulk tracks for indicated groups of cells were plotted using ArchR’s plotBrowserTrack function with default normalization method based on reads in transcription start sites (“ReadsInTSS”). Differential peak testing was performed using ArchR’s getMarkerFeatures function with testMethod = “wilcoxon” and bias = c(“TSSEnrichment”, “log10(nFrags)”). TF motif enrichment in differential peavks was performed using ArchR’s peakAnnoEnrichment function. Trajectory analysis was performed using ArchR’s addTrajectory and plotTrajectory functions. Identification of positive TF regulators was performed using ArchR’s correlateMatrices function to examine the correlation between chromVar deviation z-scores of TF motifs (“MotifMatrix”) and imputed gene expression (“GeneIntegrationMatrix”) following cross-platform linkage with scRNA-seq data using ArchR’s addGeneIntegrationMatrix.
scRNA-, TCR-seq computational methods
scRNA-seq reads were aligned to the mm10 reference genome and quantified using cellranger count (10x Genomics, version 3.1.0). Filtered gene-barcode matrices that contained only barcodes with unique molecular identifier (UMI) counts that passed the threshold for cell detection were used for further analysis. scTCR reads were aligned to the mm10 reference genome and consensus TCR annotation was performed using cellranger vdj (10x Genomics, version 3.1.0). TCR annotation was performed using the 10x cellranger vdj pipeline as described.
Additional analysis was performed in R (version 4.0.3) using Seurat (version 4.0.1) using default function parameters unless otherwise noted53. Doublets were predicted using DoubletFinder (version 2.0.3)54. Cell types were predicted using SingleR (version 1.4.1) based on mouse bulk RNA-seq reference data (MouseRNAseqData) from celldex (version 1.0.0)55. Cells with less than 200 genes detected, greater than 5% mitochondrial RNA content, predicted doublets from DoubletFinder, and cells annotated as non-T and non-NK cells by SingleR were excluded from analysis. We predicted cell cycle phase based on previously defined gene sets using the CellCycleScoring function56. We then split cells by experimental batch and cell cycle (non-cycling or G1 vs. cycling or G2M/S) into four datasets using Seurat’s SplitObject and performed batch correction using Seurat’s reciprocal PCA workflow. First, we normalized and identified variable features for each dataset independently using Seurat’s NormalizeData and FindVariableFeatures. Then we selected variable features across datasets using Seurat’s SelectIntegrationFeatures. We excluded variable TCR (^Tr.v) genes, variable Ig (^Ig.v) genes, cell cycle genes (used for cell cycle scoring), and mitochondrial genes (^mt-) from integration features used for downstream analysis. We then scaled data and ran PCA on each dataset independently using these features using Seurat’s ScaleData and RunPCA. We identified integration anchors using Seurat’s FindIntegrationAnchors using non-cycling datasets as reference datasets and rpca for dimensionality reduction. We integrated all datasets using Seurat’s IntegrateData using dims=1:50. Integrated data was used for data scaling with ScaleData and PCA dimensionality reduction with RunPCA. After initial clustering we noted three small clusters representing 7% of total cells which had low number of genes detected and high mitochondrial RNA content which were excluded from further analysis. Clusters were identified using shared nearest neighbor (SNN) based clustering based on the first 10 PCs with resolution = 0.45. The same principal components were used to generate the UMAP projections, which were generated with a minimum distance of 0.1. Cell clustering and UMAP projection for Chronic Day 21 T cells (all tissues, Figure 2 and Figure 5), spleen derived T cells (Chronic and Acute, Day 8 and Day 21, Figure 4 and Figure 6), Day 8 T cells (Spleen, Chronic and Acute, Supplemental Figure 5), Chronic including Day 5 (Spleen, Chronic, Days 5, 8, and 21, Supplemental Figure 5) were performed as described above with the following modifications:
Chronic Day 21 T cells: dims = 1:10, resolution = 0.25, min.dist = 0.1
Spleen derived T cells: dims = 1:8, k.param = 50, resolution = 0.45, min.dist = 0.1
Day 8 T cells: dims = 1:12, k.param = 40, resolution = 0.28, min.dist = 0.2
Chronic including Day 5: dims = 1:6, resolution = 0.22, min.dist = 0.01, spread = 1.5
Expression of selected genes was plotted using log normalized gene expression values based on original RNA count data prior to data integration. Marker genes were identified using Seurat’s FindAllMarkers using a cutoff of p_val_adj < 0.01. Differential gene expression analysis was performed using Seurat’s FindMarkers using a cutoff of p_val_adj < 0.05 and abs(avg_log2FC) > 0.25. Gene module scoring was performed using Seurat’s AddModuleScore. TCR clone behaviors were visualized using UpSetR (version 1.4.0). To assess if tetramer staining leads to T cell activation, we used a gene module score from the results of the pathway analysis under the term, “T cell activation”, containing the following genes: Ccr5, Cd3e, Cd3g, Hla-a, Il10ra, Irf1, Itgb2, Jak1, Maf, Nfatc1, Nfatc3, Runx3, Tgfbr2. Null distribution of TCR clone behaviors was determined by randomly shuffling TCR clonotype and scRNA phenotype and generating a distribution of TCR clone phenotype combinations (n=50 iterations). Morisita-Horn index for quantifying TCR overlap was calculated using the mh function from the R package divo (version 1.0.1).
scRNA velocity analysis
Spliced and unspliced transcript counts were computed using velocyto’s run10x (version) 0.17.17 on scRNA-seq cellranger outputs35. The resulting loom files were used for subsequent RNA velocity analysis and visualization with dynamo (version 1.0.0). Preprocessing was performed using dynamo.pp.recipe_monocle. RNA velocity was computed using dynamo.tl.dynamics with model=‘stochastic’. Cell transition probabilities were computed using dynamo.tl.cell_velocities with method=‘pearson’ and other_kernels_dict={‘transform’: ‘sqrt’}. RNA velocity was visualized using dynamo.pl.streamline_plot. Pseudotime was estimated using single cell potential (umap_ddhodge_potential) based on the vector field topology computed using dynamo.vf.VectorField with basis=‘umap’ and dynamo.ext.ddhodge with basis=‘umap’. We note here that a caveat of these analyses is that highly distinct transcriptional cell states (e.g., Texterm or Texprog; similarly, in Arm infection Teff, Tem, or Tnaive), as well as local minima/maxima neighboring distinct cell states, can drive velocity signal, influencing ‘start’ or ‘end’ points of the analysis. Further, RNA velocity pseudotime is calculated from the potential of the RNA velocity field and summarizes the direction and magnitude of the dominant local trajectories in UMAP space, rather than nominating terminal differentiation states. Differentiation predictions from these studies should be validated using orthogonal lineage-tracing and adoptive transfer experiments.
Human scRNA-, TCR-seq analysis
Processed scRNA-, TCR-seq data from human tumor-infiltrating T cells were downloaded from zenodo38. For further analysis we used scRNA-seq expression data from the R object data/expression/CD8/integration/CD8.thisStudy_10X.seu.rds and scTCR-seq data from the R object data/tcr/byCell/tcr.zhangLab.comb.flt.rds. Additional analysis was performed using Seurat (version 4.0.1). Phenotypic clusters were defined using the provided meta.cluster.simplified assignment. Enrichment of mouse LCMV gene signatures was calculated using Seurat’s AddModuleScore. TCR clones were defined using the provided cloneID annotation. TCR clone behaviors for tumor-infiltrating T cells (loc == ‘T’) were visualized using UpSetR (version 1.4.0). For UMAP visualization of single cells, provided normalized expression data was batch corrected using harmony’s RunHarmony based on the ‘patient’ variable (version 1.0)57. The first 10 harmonized embeddings were used to generate the UMAP projections, which were generated with a minimum distance of 0.1.
Statistics and Reproducibility
Statistical analyses were performed in R or GraphPad Prism. Gene expression measurements by qPCR were presented as means +/− SD. In the bar graphs, significant changes were determined by two tailed, unpaired t-test at p<0.05. The exact replicate numbers are indicated in the figure legends for each experiment. Differential gene expression analysis was performed using a cutoff of adjusted p-value < 0.05 and absolute (average_log2 fold change) > 0.25. Statistical parameters are also reported in the figure legends. Data distribution was assumed to be normal but this was not formally tested. No statistical test was used to predetermine sample size. No data were excluded from the analysis. The experiments were not randomized. The Investigators were not blind to allocation during experiments and outcome assessment.
Data Availability:
All sequencing data generated in this study is available under GEO accession: GSE188670.
Code Availability:
Custom code used in this study is available at https://github.com/katieyost/LCMV-code-2022.
Extended Data
Extended Data Figure 1. Sorting strategy and quality controls for scATAC-seq data.

(a) Sorting strategy to obtain antigen specific gp33+ and gp33− CD8+ T cells from different organs. (b) Sorting strategy to obtain the main Tex subsets (left). UMAPs of scRNA-seq and scATAC-seq results, originating from the indicated Tex subsets. (c) Bar plot of cell counts from the scRNA-seq samples (top). Stacked bar plot of the phenotypic composition of the indicated scRNA-seq samples (bottom). (d) Quality control of scATAC-seq data. Histogram shows normalized read enrichment on the transcription start sites (TSS) of genes from the indicated samples (top). Density plots depict the cells that passed the TSS enrichment and Log10 unique fragment count threshold. Median TSS enrichment (MTE) is also indicated. (e) Density plots of scATAC-seq data from the main Tex populations depicting the same quality controls as panel (c). (f) UMAP of scATAC-seq data colored by integrated scRNA-seq cluster labels. (g) Heat map of TF motif enrichment at the specific open chromatin regions (OCRs) of the annotated T cell populations (p-values determined by hypergeometric enrichment and adjusted using the Bonferroni correction method).
Extended Data Figure 2. Characterization of Texint and TexKLR subsets and organ-specific exhaustion signatures.

(a) Ingenuity pathway analyses of the differentially expressed genes identifying enriched biological pathways between the two subsets (Texint versus TexKLR). Top 6 hits are shown. (b) Representative flow cytometry plots that quantify CXCR6 expression in Texterm, Texint and Texprog. Barplots summarize the quantification across three biological replicates. Significant changes were determined by two tailed, unpaired t-test at p<0.05 (n=3). Shown are means with SDs. (c) Representative flow cytometry plots show the MKI67+ fractions of the indicated Tex subsets. Boxplot depicts the quantification of MKI67+ Tex subsets. Significant changes were determined by two tailed, unpaired t-test at p<0.05 (n=5 biologically independent animals). Box center line, mean; limits, upper and lower quartiles; whiskers, minimum and maximum values. (d) Volcano plots of differentially expressed genes comparing Texterm populations from different organs (log2 FC > 0.25, Bonferroni adjusted p-value < 0.01, p-values determined by two-sided Wilcoxon Rank Sum test). Ingenuity pathway analysis results on the differentially expressed gene groups (bottom). Top 3 hits are shown. (e) Violin plots of the Cell Cycle score of the indicated T cell populations across organs (n = number of scRNA-seq profiles, box center line, median; box limits, upper and lower quartiles; box whiskers, 1.5× interquartile range). P-values determined by two-sided Wilcoxon Rank Sum test relative to overall distribution of single cells from the indicated Tex subsets across all organs. (f) Representative flow cytometry of the MKI67+ fraction of Texterm subsets in the indicated organs. Bar plot summarizes MKI67+ fractions across organs. Significant changes were determined by two tailed, unpaired t-test at p<0.05 (n=3 biologically independent animals). Shown are means with SDs.
Extended Data Figure 3. Analysis of highly-expanded T cell clones in Arm and Cl13 infection.
(a) UMAPs of highly expanded clones from the Arm infection model at the indicated time points. (b) UMAPs of highly expanded clones of the Cl13 infection model at the indicated time points. (c) Stacked bar plot of the phenotypic composition of individual T cell clones with a bias towards the TexKLR fate that also contain some cells with the Texterm phenotype. Top 6 clones are shown. (d) Upset plot of the phenotype combinations of the observed and shuffled TCR clones. Bar represents the mean and error bars represent standard deviation for 50 randomized TCR shuffling iterations performed to obtain the shuffled distribution.
Extended Data Figure 4. RNA velocity analysis of a divergent clone and regulatory programs of exhaustion.

(a) Heat maps depict the gene expression program of a gp33-reactive divergent clone, differentiating from the Texint stage into either Texterm or TexKLR fates (left). Pseudotime order (direction of differentiation) was determined by RNA velocity analysis and is presented on a UMAP (right). (b) UMAPs of gp33+ CD8+ T cells from Arm infection at D8 and D21 and gp33− at D21. Color gradient (RNA velocity pseudotime order) indicates directions of T cell differentiation fates determined by RNA velocity analysis. (c) UMAP of scATAC-seq results of D8 and D21 gp33+ and gp33− T cells from Cl13 infection. UMAP is colored by the annotated T cell subsets. Small UMAPs (right) show T cells that originate from the indicated gp33 fractions and timepoints. (d) Heat map of Peak score values at the unique open chromatin regions (OCRs) of the T cell subsets determined by scATAC-seq with a list of annotated putative target genes based on proximity (left, log2 FC > 1, FDR < 0.05, p-values determined by two-sided Wilcoxon Rank Sum test and adjusted using the Benjamini & Hochberg procedure to obtain FDRs). Heat map of motif enrichment results at the unique OCR sets of the annotated T cell subsets (right, p-values determined by hypergeometric enrichment and adjusted using the Bonferroni correction method). (e) Upset plot of differentially accessible OCRs relative to Tnaive at the Tox gene locus and their overlap among the different Tex subsets (log2 FC > 1, FDR < 0.01, p-values determined by two-sided Wilcoxon Rank Sum test and adjusted using the Benjamini & Hochberg procedure to obtain FDRs). Violin plot shows the gene expression level of Tox in the identified Tex subsets. Box center line, median; box limits, upper and lower quartiles; box whiskers, 1.5× interquartile range.
Extended Data Figure 5. Molecular programs of early effector- and progenitor-exhausted T cells and fate mapping experiments.

(a) UMAPs of scATAC-seq (left) and scRNA-seq (right) results from the infection models. Small UMAPs are colored by sample of origin (bottom). (b) Stacked bar plot depicts the phenotypic distribution of gp33+ CD8 T cells from scRNA-seq. (c) Volcano plot of differentially expressed genes (DEGs) between memory precursor T cells (Tmp) from Arm and the precursor exhausted T cells (Texprec) from Cl13 infections (top left). Differential gene expression analyses were performed as follows: log2 FC > 0.25, Bonferroni adjusted p-value < 0.01, p-values determined by two-sided Wilcoxon Rank Sum test.. Ingenuity pathway analyses of the Tmp and Texprog specific gene sets. Volcano plot of the differential open chromatin regions (OCRs) of the Tmp and Texprec populations (top right). Differential OCR analyses were performed as follows: log2 FC > 1, FDR < 0.1, p-values determined by two-sided Wilcoxon Rank Sum test and adjusted using the Benjamini & Hochberg procedure to obtain FDRs. Enriched transcription factor (TF) motifs in specific OCRs of Tmp and Texprog subsets are shown (p-values determined by hypergeometric enrichment and adjusted using the Bonferroni correction method). (d) DEGs between the D8 effector T cells (Teff) from Arm and early effector Tex cells (Texeeff) from Cl13 infections (top left). Same statistical approach was used as in (c). Ingenuity pathway analyses of the Teff and Texeeff specific gene sets (bottom left). Volcano plot depicts the differentially accessible OCRs of Teff and Texeeff populations (right). Same statistical approach was used as in (c). Enriched TF motifs in Teff and Texeeff specific OCR sets (p-values determined by hypergeometric enrichment and adjusted using the Bonferroni correction method). (e) Expression of the indicated genes profiled by scRNA-seq. Box center line, mean; limits, upper and lower quartiles; whiskers, minimum and maximum values. (f) Schematic of the Texeeff adoptive transfer experiment with pre-transfer sorting strategy (top). Representative flow cytometry plots show the analysis of the phenotypic content of recovered T cells. Stacked bar plots show the phenotypic distribution from 3 biologically independent animals (mean % of each subset is shown with SDs). (g) Heat map of differentially expressed TFs in Tex subsets. (h) Upset plot of differentially accessible OCRs of TexKLR and Texterm relative to Texint (log2 FC > 1, FDR < 0.01, p-values determined by two-sided Wilcoxon Rank Sum test and adjusted using the Benjamini & Hochberg procedure to obtain FDRs) and their overlap. (i) Schematic of lineage tracing experiment (left). Gating strategy to analyze tdTomato+ fractions of Tex subsets. Boxplot of the % of tdTomato+ Tex subsets are shown. Box center line, mean; limits, upper and lower quartiles; whiskers, minimum and maximum values (n = 4 biologically independent animals).
Extended Data Figure 6. scRNA/TCR-seq reveals T cell clone behaviors in different organs.

(a) Heat map of the fraction overlap between the TCR repertoires of the indicated gp33+ and gp33− CD8+ T cell subsets from different organs. (b) Stacked bar plot of the phenotypic composition of individual clones with divergent behavior across organs. (c) Schematic of the definition of an expanded, organ-shared T cell clone for clone behavior analysis. Only clones that had at least 5 T cells present in each organ were considered. Shared clone numbers across the organs are indicated (left). Table depicting the number of expanded clones that are shared across tissues and their clone behaviors (right). (d) Gene expression analysis of LCMV-gp transcript (left) and Il21 transcript (right) in indicated organs at D22 following Cl13 infection. Significant changes were determined by two tailed, unpaired t-test (n=10 biologically independent animals). Box center line, mean; limits, upper and lower quartiles; whiskers, minimum and maximum values.
Extended Data Figure 7. scRNA-seq reveals the phenotypic composition of gp33−, gp33int, and gp33high T cell subsets.

(a) UMAPs of cell profiled by scRNA-seq in the three gp33 T cell fractions colored by the annotated T cell subsets. (b) Venn diagram shows the overlap of all detected TCR clones among the three gp33 T cell fractions. (c) Heat map depicting TCR repertoire overlap (Morisita index) among the different gp33 fractions from the indicated samples. (d) Pie chart representation of the fraction of the detected clone sizes in the three gp33 T cell fractions. (e) Stacked bar plot of the phenotypic distribution of the unique clones from the three gp33 T cell fractions. (f) UMAPs of unique TCR clones determined by scRNA/TCR-seq and colored by the phenotypic distribution of the three gp33 fractions of T cells. (g) Representative flow cytometry plots depict the gating strategy to analyze the fractions of Tex subsets in gp33−, gp33int, and gp33high CD8+ T cells. Bar plots quantify the frequencies of the indicated Tex subsets in each gp33 fraction. Significant changes were determined by two tailed, unpaired t-test at p<0.05 (n=3 biologically independent animals). Shown are means with SDs. (h) Representative flow cytometry plots depict the gating strategy to analyze the functionality (IFNG/LAMP1 double positive CD8+ T cells) of gp33, gp33int, and gp33high CD8+ T cells. Boxplot quantifies the double positive fractions of T cells in each gp33 fraction. Significant changes were determined by two tailed, unpaired t-test at p<0.05 (n=7 biologically independent animals). Box center line, mean; limits, upper and lower quartiles; whiskers, minimum and maximum values. (i) Stacked bar plots show the phenotypic content of TCR clones that were tested for TCR signaling avidity. CDR3 amino acid sequences are indicated.
Extended Data Figure 8. Human expanded TILs exhibit divergent, Texterm- and TexKLR-biased clone behaviors.

(a) Upset plot depicting the combination of phenotypes (clone behaviors) for expanded TIL clones. For clarity, the top 10 most common clone behaviors are shown. Bar plot shows the number of clones with the indicated phenotypes. (b) UMAPs of representative expanded TIL clones with the indicated clone behaviors.
Supplementary Material
Supplementary Table 1. Marker genes of the identified T cell subsets defined by scRNA-seq. Statistical test: log2 FC >0.25, Bonferroni adjusted p-value <0.01, two-sided Wilcoxon Rank Sum test.
Supplementary Table 2. Marker Gene Scores and Peak Scores of the identified T cell subsets defined by scATAC-seq. Statistical test: log2 FC >0.5, FDR <0.01, two-sided Wilcoxon Rank Sum test adjusted using Benjamini & Hochberg procedure. Peak scores: log2 FC >1, FDR <0.05, two-sided Wilcoxon Rank Sum test adjusted using Benjamini & Hochberg procedure.
Supplementary Table 3. Enriched transcription factor motifs at the specific open chromatin regions of the defined T cell subsets. Statistical test: p-values determined by hypergeometric enrichment and adjusted using the Bonferroni correction method.
Supplementary Table 4. Differentially expressed genes between D21 Texint and TexKLR. Statistical test: log2 FC >0.25, Bonferroni adjusted p-value <0.01, two-sided Wilcoxon Rank Sum test.
Supplementary Table 5. Differentially expressed genes between TexKLR and Texterm. Statistical test: log2 FC >0.25, Bonferroni adjusted p-value <0.01, two-sided Wilcoxon Rank Sum test.
Supplementary Table 6. Differentially expressed genes between Texterm from the spleen and the liver. Statistical test: log2 FC >0.25, Bonferroni adjusted p-value <0.01, two-sided Wilcoxon Rank Sum test.
Supplementary Table 7. Differentially expressed genes between Texterm from the spleen and the lung. Statistical test: log2 FC >0.25, Bonferroni adjusted p-value <0.01, two-sided Wilcoxon Rank Sum test.
Supplementary Table 8. Differentially expressed genes between Texterm from the lung and the liver. Statistical test: log2 FC >0.25, Bonferroni adjusted p-value <0.01, two-sided Wilcoxon Rank Sum test.
Supplementary Table 9. Differential open chromatin regions at the Tox locus from the different exhausted T cell subsets relative to Tnaive. Statistical test: log2 FC > 1, FDR < 0.01, p-values determined by two-sided Wilcoxon Rank Sum test and adjusted using the Benjamini & Hochberg procedure to obtain FDRs.
Supplementary Table 10. Differentially expressed genes between Tmp and Texprec. Statistical test: log2 FC >0.25, Bonferroni adjusted p-value <0.01, two-sided Wilcoxon Rank Sum test.
Supplementary Table 11. Differentially expressed genes between Texeeff and Teff from D8. Statistical test: log2 FC >0.25, Bonferroni adjusted p-value <0.01, two-sided Wilcoxon Rank Sum test.
Supplementary Table 12. Full-length TCR sequences used for TCR signaling avidity testing with NFAT-GFP reporter T cell hybridoma cell line.
Acknowledgements:
We thank the members of the Satpathy, Egawa, and Chang labs for stimulating discussions. We thank Kenneth Murphy, Washington University, for providing the NFAT-GFP reporter cells and Chyi-Song Hsieh, Washington University, for providing the MSCV-based retroviral plasmid MigCaRCh. This work was supported by the National Institutes of Health (NIH) K08CA230188 (A.T.S.), U01CA260852 (A.T.S.), RM1-HG007735 (H.Y.C.), R01AI130152 (T.E.), R21AI161040 (T.E.), a Career Award for Medical Scientists from the Burroughs Wellcome Fund (A.T.S.), a Technology Impact Award and a Lloyd J. Old STAR Award from the Cancer Research Institute (A.T.S.), an ASH Scholar Award from the American Society of Hematology (A.T.S.), the Parker Institute for Cancer Immunotherapy (E.J.W., H.Y.C., and A.T.S.), a Pew-Stewart Scholars for Cancer Research Award (A.T.S.), a Baxter Foundation Faculty Scholar Award, a Leukemia and Lymphoma Society Scholar Award (T.E.), and the Scleroderma Research Foundation (H.Y.C.). H.Y.C. is an investigator of the Howard Hughes Medical Institute. K.E.Y. was supported by the National Science Foundation Graduate Research Fellowship Program (NSF DGE-1656518), a Stanford Graduate Fellowship and a NCI Predoctoral to Postdoctoral Fellow Transition Award (NIH F99CA253729). J.A.B was supported by a Stanford Graduate Fellowship and a National Science Foundation Graduate Research Fellowship under Grant No. DGE-1656518. The sequencing data was generated with instrumentation purchased with NIH funds: S10OD018220 and 1S10OD021763.
Competing Interest Statement:
A.T.S. is a founder of Immunai and Cartography Biosciences and receives research funding from Allogene Therapeutics and Merck Research Laboratories. H.Y.C. is a co-founder of Accent Therapeutics, Boundless Bio and Cartography Biosciences, and an advisor to 10x Genomics, Arsenal Biosciences, and Spring Discovery. K.E.Y. is a consultant for Cartography Biosciences. J.A.B. is a consultant for Immunai. E.J.W. is an advisor for Merck, Marengo, Janssen, Related Sciences, Synthekine, and Surface Oncology. E.J.W. is a founder of Surface Oncology, Danger Bio, and Arsenal Biosciences. E.J.W. has a patent on the PD1 pathway. The remaining authors declare no competing interests.
References:
- 1.Hashimoto M et al. CD8 T Cell Exhaustion in Chronic Infection and Cancer: Opportunities for Interventions. Annu Rev Med 69, 301–318 (2018). [DOI] [PubMed] [Google Scholar]
- 2.McLane LM, Abdel-Hakeem MS & Wherry EJ CD8 T Cell Exhaustion During Chronic Viral Infection and Cancer. Annu Rev Immunol 37, 457–495 (2019). [DOI] [PubMed] [Google Scholar]
- 3.Blank CU et al. Defining ‘T cell exhaustion’. Nat Rev Immunol 19, 665–674 (2019). [DOI] [PMC free article] [PubMed] [Google Scholar]
- 4.Scott AC et al. TOX is a critical regulator of tumour-specific T cell differentiation. Nature 571, 270–274 (2019). [DOI] [PMC free article] [PubMed] [Google Scholar]
- 5.Paley MA et al. Progenitor and terminal subsets of CD8+ T cells cooperate to contain chronic viral infection. Science 338, 1220–1225 (2012). [DOI] [PMC free article] [PubMed] [Google Scholar]
- 6.Im SJ et al. Defining CD8+ T cells that provide the proliferative burst after PD-1 therapy. Nature 537, 417–421 (2016). [DOI] [PMC free article] [PubMed] [Google Scholar]
- 7.Utzschneider DT et al. T Cell Factor 1-Expressing Memory-like CD8(+) T Cells Sustain the Immune Response to Chronic Viral Infections. Immunity 45, 415–427 (2016). [DOI] [PubMed] [Google Scholar]
- 8.Hudson WH et al. Proliferating Transitory T Cells with an Effector-like Transcriptional Signature Emerge from PD-1(+) Stem-like CD8(+) T Cells during Chronic Infection. Immunity 51, 1043–1058 e1044 (2019). [DOI] [PMC free article] [PubMed] [Google Scholar]
- 9.Zander R et al. CD4(+) T Cell Help Is Required for the Formation of a Cytolytic CD8(+) T Cell Subset that Protects against Chronic Infection and Cancer. Immunity 51, 1028–1042 e1024 (2019). [DOI] [PMC free article] [PubMed] [Google Scholar]
- 10.Beltra JC et al. Developmental Relationships of Four Exhausted CD8(+) T Cell Subsets Reveals Underlying Transcriptional and Epigenetic Landscape Control Mechanisms. Immunity 52, 825–841 e828 (2020). [DOI] [PMC free article] [PubMed] [Google Scholar]
- 11.He R et al. Follicular CXCR5- expressing CD8(+) T cells curtail chronic viral infection. Nature 537, 412–428 (2016). [DOI] [PubMed] [Google Scholar]
- 12.Wu T et al. The TCF1-Bcl6 axis counteracts type I interferon to repress exhaustion and maintain T cell stemness. Sci Immunol 1 (2016). [DOI] [PMC free article] [PubMed] [Google Scholar]
- 13.Raju S et al. Identification of a T-bet(hi) Quiescent Exhausted CD8 T Cell Subpopulation That Can Differentiate into TIM3(+)CX3CR1(+) Effectors and Memory-like Cells. J Immunol 206, 2924–2936 (2021). [DOI] [PMC free article] [PubMed] [Google Scholar]
- 14.Utzschneider DT et al. Early precursor T cells establish and propagate T cell exhaustion in chronic infection. Nat Immunol 21, 1256–1266 (2020). [DOI] [PubMed] [Google Scholar]
- 15.Sandu I et al. Landscape of Exhausted Virus-Specific CD8 T Cells in Chronic LCMV Infection. Cell Rep 32, 108078 (2020). [DOI] [PubMed] [Google Scholar]
- 16.Khan O et al. TOX transcriptionally and epigenetically programs CD8(+) T cell exhaustion. Nature 571, 211–218 (2019). [DOI] [PMC free article] [PubMed] [Google Scholar]
- 17.Alfei F et al. TOX reinforces the phenotype and longevity of exhausted T cells in chronic viral infection. Nature 571, 265–269 (2019). [DOI] [PubMed] [Google Scholar]
- 18.Yao C et al. BACH2 enforces the transcriptional and epigenetic programs of stem-like CD8(+) T cells. Nat Immunol 22, 370–380 (2021). [DOI] [PMC free article] [PubMed] [Google Scholar]
- 19.Yao C et al. Single-cell RNA-seq reveals TOX as a key regulator of CD8(+) T cell persistence in chronic infection. Nat Immunol 20, 890–901 (2019). [DOI] [PMC free article] [PubMed] [Google Scholar]
- 20.Seo H et al. TOX and TOX2 transcription factors cooperate with NR4A transcription factors to impose CD8(+) T cell exhaustion. Proc Natl Acad Sci U S A 116, 12410–12415 (2019). [DOI] [PMC free article] [PubMed] [Google Scholar]
- 21.Belk JA, Daniel B & Satpathy AT Epigenetic regulation of T cell exhaustion. Nat Immunol 23, 848–860 (2022). [DOI] [PMC free article] [PubMed] [Google Scholar]
- 22.Pauken KE et al. Epigenetic stability of exhausted T cells limits durability of reinvigoration by PD-1 blockade. Science 354, 1160–1165 (2016). [DOI] [PMC free article] [PubMed] [Google Scholar]
- 23.Matloubian M, Kolhekar SR, Somasundaram T & Ahmed R Molecular determinants of macrophage tropism and viral persistence: importance of single amino acid changes in the polymerase and glycoprotein of lymphocytic choriomeningitis virus. J Virol 67, 7340–7349 (1993). [DOI] [PMC free article] [PubMed] [Google Scholar]
- 24.Pliner HA et al. Cicero Predicts cis-Regulatory DNA Interactions from Single-Cell Chromatin Accessibility Data. Mol Cell 71, 858–871 e858 (2018). [DOI] [PMC free article] [PubMed] [Google Scholar]
- 25.Schep AN, Wu B, Buenrostro JD & Greenleaf WJ chromVAR: inferring transcription-factor-associated accessibility from single-cell epigenomic data. Nat Methods 14, 975–978 (2017). [DOI] [PMC free article] [PubMed] [Google Scholar]
- 26.Chen Y et al. BATF regulates progenitor to cytolytic effector CD8(+) T cell transition during chronic viral infection. Nat Immunol 22, 996–1007 (2021). [DOI] [PMC free article] [PubMed] [Google Scholar]
- 27.Stelekati E et al. Long-Term Persistence of Exhausted CD8 T Cells in Chronic Infection Is Regulated by MicroRNA-155. Cell Rep 23, 2142–2156 (2018). [DOI] [PMC free article] [PubMed] [Google Scholar]
- 28.Chen J et al. NR4A transcription factors limit CAR T cell function in solid tumours. Nature 567, 530–534 (2019). [DOI] [PMC free article] [PubMed] [Google Scholar]
- 29.Liu X et al. Genome-wide analysis identifies NR4A1 as a key mediator of T cell dysfunction. Nature 567, 525–529 (2019). [DOI] [PMC free article] [PubMed] [Google Scholar]
- 30.Shan Q et al. The transcription factor Runx3 guards cytotoxic CD8(+) effector T cells against deviation towards follicular helper T cell lineage. Nat Immunol 18, 931–939 (2017). [DOI] [PMC free article] [PubMed] [Google Scholar]
- 31.Martinez GJ et al. The transcription factor NFAT promotes exhaustion of activated CD8(+) T cells. Immunity 42, 265–278 (2015). [DOI] [PMC free article] [PubMed] [Google Scholar]
- 32.Chung HK, McDonald B & Kaech SM The architectural design of CD8+ T cell responses in acute and chronic infection: Parallel structures with divergent fates. J Exp Med 218 (2021). [DOI] [PMC free article] [PubMed] [Google Scholar]
- 33.Evrard M et al. Sphingosine 1-phosphate receptor 5 (S1PR5) regulates the peripheral retention of tissue-resident lymphocytes. J Exp Med 219 (2022). [DOI] [PMC free article] [PubMed] [Google Scholar]
- 34.Milner JJ et al. Delineation of a molecularly distinct terminally differentiated memory CD8 T cell population. Proc Natl Acad Sci U S A 117, 25667–25678 (2020). [DOI] [PMC free article] [PubMed] [Google Scholar]
- 35.La Manno G et al. RNA velocity of single cells. Nature 560, 494–498 (2018). [DOI] [PMC free article] [PubMed] [Google Scholar]
- 36.Qiu X et al. Mapping transcriptomic vector fields of single cells. Cell 185, 690–711 e645 (2022). [DOI] [PMC free article] [PubMed] [Google Scholar]
- 37.Pritykin Y et al. A unified atlas of CD8 T cell dysfunctional states in cancer and infection. Mol Cell 81, 2477–2493 e2410 (2021). [DOI] [PMC free article] [PubMed] [Google Scholar]
- 38.Zheng L et al. Pan-cancer single-cell landscape of tumor-infiltrating T cells. Science 374, abe6474 (2021). [DOI] [PubMed] [Google Scholar]
- 39.Sen DR et al. The epigenetic landscape of T cell exhaustion. Science 354, 1165–1169 (2016). [DOI] [PMC free article] [PubMed] [Google Scholar]
- 40.Philip M & Schietinger A Heterogeneity and fate choice: T cell exhaustion in cancer and chronic infections. Curr Opin Immunol 58, 98–103 (2019). [DOI] [PMC free article] [PubMed] [Google Scholar]
- 41.Stadtmauer EA et al. CRISPR-engineered T cells in patients with refractory cancer. Science 367 (2020). [DOI] [PMC free article] [PubMed] [Google Scholar]
- 42.Chang JT, Wherry EJ & Goldrath AW Molecular regulation of effector and memory T cell differentiation. Nat Immunol 15, 1104–1115 (2014). [DOI] [PMC free article] [PubMed] [Google Scholar]
- 43.Daniels MA & Teixeiro E TCR Signaling in T Cell Memory. Front Immunol 6, 617 (2015). [DOI] [PMC free article] [PubMed] [Google Scholar]
- 44.Mold JE et al. Divergent clonal differentiation trajectories establish CD8(+) memory T cell heterogeneity during acute viral infections in humans. Cell Rep 35, 109174 (2021). [DOI] [PubMed] [Google Scholar]
- 45.Good CR et al. An NK-like CAR T cell transition in CAR T cell dysfunction. Cell 184, 6081–6100 e6026 (2021). [DOI] [PMC free article] [PubMed] [Google Scholar]
- 46.Chou C et al. The Transcription Factor AP4 Mediates Resolution of Chronic Viral Infection through Amplification of Germinal Center B Cell Responses. Immunity 45, 570–582 (2016). [DOI] [PMC free article] [PubMed] [Google Scholar]
- 47.Satpathy AT et al. Massively parallel single-cell chromatin landscapes of human immune cell development and intratumoral T cell exhaustion. Nat Biotechnol 37, 925–936 (2019). [DOI] [PMC free article] [PubMed] [Google Scholar]
- 48.Song L et al. TRUST4: immune repertoire reconstruction from bulk and single-cell RNA-seq data. Nat Methods 18, 627–630 (2021). [DOI] [PMC free article] [PubMed] [Google Scholar]
- 49.Ise W et al. CTLA-4 suppresses the pathogenicity of self antigen-specific T cells by cell-intrinsic and cell-extrinsic mechanisms. Nat Immunol 11, 129–135 (2010). [DOI] [PMC free article] [PubMed] [Google Scholar]
- 50.Letourneur F & Malissen B Derivation of a T cell hybridoma variant deprived of functional T cell receptor alpha and beta chain transcripts reveals a nonfunctional alpha-mRNA of BW5147 origin. Eur J Immunol 19, 2269–2274 (1989). [DOI] [PubMed] [Google Scholar]
- 51.Granja JM et al. ArchR is a scalable software package for integrative single-cell chromatin accessibility analysis. Nat Genet 53, 403–411 (2021). [DOI] [PMC free article] [PubMed] [Google Scholar]
- 52.van Dijk D et al. Recovering Gene Interactions from Single-Cell Data Using Data Diffusion. Cell 174, 716–729 e727 (2018). [DOI] [PMC free article] [PubMed] [Google Scholar]
- 53.Hao Y et al. Integrated analysis of multimodal single-cell data. Cell 184, 3573–3587 e3529 (2021). [DOI] [PMC free article] [PubMed] [Google Scholar]
- 54.McGinnis CS, Murrow LM & Gartner ZJ DoubletFinder: Doublet Detection in Single-Cell RNA Sequencing Data Using Artificial Nearest Neighbors. Cell Syst 8, 329–337 e324 (2019). [DOI] [PMC free article] [PubMed] [Google Scholar]
- 55.Aran D et al. Reference-based analysis of lung single-cell sequencing reveals a transitional profibrotic macrophage. Nat Immunol 20, 163–172 (2019). [DOI] [PMC free article] [PubMed] [Google Scholar]
- 56.Tirosh I et al. Dissecting the multicellular ecosystem of metastatic melanoma by single-cell RNA-seq. Science 352, 189–196 (2016). [DOI] [PMC free article] [PubMed] [Google Scholar]
- 57.Korsunsky I et al. Fast, sensitive and accurate integration of single-cell data with Harmony. Nat Methods 16, 1289–1296 (2019). [DOI] [PMC free article] [PubMed] [Google Scholar]
Associated Data
This section collects any data citations, data availability statements, or supplementary materials included in this article.
Supplementary Materials
Supplementary Table 1. Marker genes of the identified T cell subsets defined by scRNA-seq. Statistical test: log2 FC >0.25, Bonferroni adjusted p-value <0.01, two-sided Wilcoxon Rank Sum test.
Supplementary Table 2. Marker Gene Scores and Peak Scores of the identified T cell subsets defined by scATAC-seq. Statistical test: log2 FC >0.5, FDR <0.01, two-sided Wilcoxon Rank Sum test adjusted using Benjamini & Hochberg procedure. Peak scores: log2 FC >1, FDR <0.05, two-sided Wilcoxon Rank Sum test adjusted using Benjamini & Hochberg procedure.
Supplementary Table 3. Enriched transcription factor motifs at the specific open chromatin regions of the defined T cell subsets. Statistical test: p-values determined by hypergeometric enrichment and adjusted using the Bonferroni correction method.
Supplementary Table 4. Differentially expressed genes between D21 Texint and TexKLR. Statistical test: log2 FC >0.25, Bonferroni adjusted p-value <0.01, two-sided Wilcoxon Rank Sum test.
Supplementary Table 5. Differentially expressed genes between TexKLR and Texterm. Statistical test: log2 FC >0.25, Bonferroni adjusted p-value <0.01, two-sided Wilcoxon Rank Sum test.
Supplementary Table 6. Differentially expressed genes between Texterm from the spleen and the liver. Statistical test: log2 FC >0.25, Bonferroni adjusted p-value <0.01, two-sided Wilcoxon Rank Sum test.
Supplementary Table 7. Differentially expressed genes between Texterm from the spleen and the lung. Statistical test: log2 FC >0.25, Bonferroni adjusted p-value <0.01, two-sided Wilcoxon Rank Sum test.
Supplementary Table 8. Differentially expressed genes between Texterm from the lung and the liver. Statistical test: log2 FC >0.25, Bonferroni adjusted p-value <0.01, two-sided Wilcoxon Rank Sum test.
Supplementary Table 9. Differential open chromatin regions at the Tox locus from the different exhausted T cell subsets relative to Tnaive. Statistical test: log2 FC > 1, FDR < 0.01, p-values determined by two-sided Wilcoxon Rank Sum test and adjusted using the Benjamini & Hochberg procedure to obtain FDRs.
Supplementary Table 10. Differentially expressed genes between Tmp and Texprec. Statistical test: log2 FC >0.25, Bonferroni adjusted p-value <0.01, two-sided Wilcoxon Rank Sum test.
Supplementary Table 11. Differentially expressed genes between Texeeff and Teff from D8. Statistical test: log2 FC >0.25, Bonferroni adjusted p-value <0.01, two-sided Wilcoxon Rank Sum test.
Supplementary Table 12. Full-length TCR sequences used for TCR signaling avidity testing with NFAT-GFP reporter T cell hybridoma cell line.
Data Availability Statement
All sequencing data generated in this study is available under GEO accession: GSE188670.