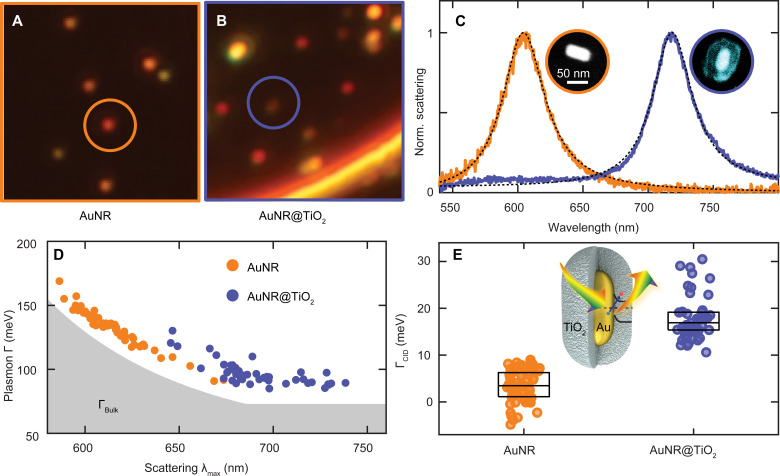
Fig. 2. Single-particle dark-field scattering spectroscopy to determine CID.
(A) Dark-field scattering image of single AuNRs. (B) Dark-field scattering image of single AuNRs@TiO2. (C) Normalized correlated single-particle scattering spectra of a representative single AuNR (orange) and AuNR@TiO2 (blue) with core sizes of 25 × 53 ± 2 nm and 25 × 55 ± 2 nm and their Lorentzian fits (black dashed lines). Inset: Color-coded correlated electron micrographs. (D) Plasmon linewidth (Γ) as a function of scattering maximum (λmax) calculated from Lorentzian fits for single AuNRs (orange) and AuNRs@TiO2 (blue). The gray shaded area represents the bulk damping intrinsic to Au (ΓBulk). Error estimates from the fits for λmax and Γ are roughly the size of the data points. (E) Distributions of ΓCID values for AuNRs (orange) and AuNRs@TiO2 (blue) obtained from the difference between measured Γ and size-dependent bulk and radiation damping for every single particle based on correlated electron microscopy. Inset: Schematic illustration of the experimental design for investigating CID in AuNR@TiO2 heterostructures. Data points of individual AuNRs and AuNRs@TiO2 are distributed along the x axis for visualization. The box plots represent the interquartile range and the median of the distributions. The AuNRs@TiO2 exhibit significant ΓCID (19 ± 7 meV) compared to the bare AuNRs (3 ± 4 meV); t(108) = 14.8, P < 0.0001.

