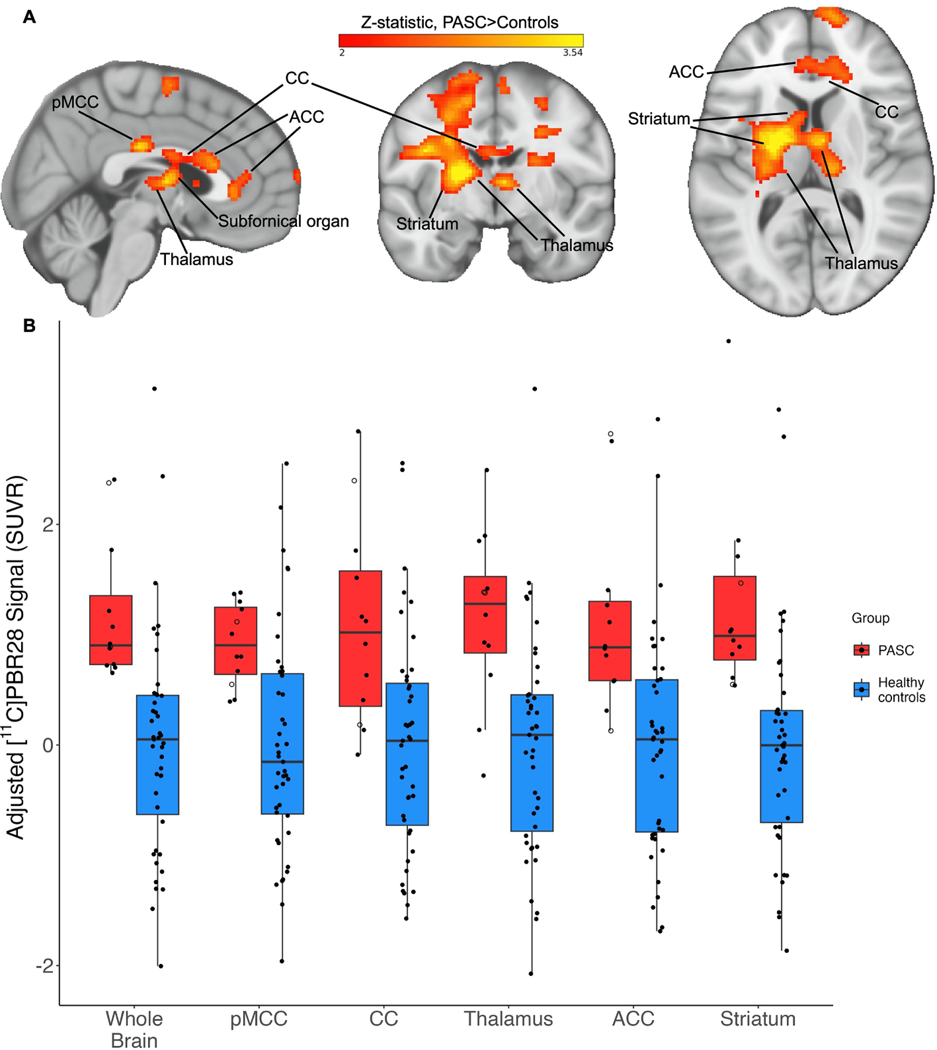
Fig. 1.
(A): Example slices through sagittal (x = 3), coronal (y = −7), and axial (z = 10) sections of the 12 PASC > 43 control group-level unpaired (between-groups) comparison, showing the pattern of increased [11C]PBR28 signal (shown in neurological convention). Color bar: threshold min. Z score of 2 and max. 3.54. (B): PET signal data extracted from individual study participants, depicted from the primary whole-brain analysis and across five example bilateral brain regions. Y-axis data points represent the mean SUVR values of significant voxels within each significant cluster region, with each structure’s data normalized to the control average. PASC participants hospitalized during their acute COVID-19 illness are indicated with an open circle. Brain regions are anatomically defined by the Harvard-Oxford Atlas (thalamus, ACC, striatum) or CC by the Jüelich Atlas at >70% probability threshold. In the case of the pMCC, we used the Harvard-Oxford posterior cingulate anatomical mask, but the activation cluster was only within pMCC. In the PASC group, the two hospitalized cases are depicted by open circles. pMCC = posterior midcingulate cortex; CC = corpus callosum; ACC = anterior cingulate cortex.

