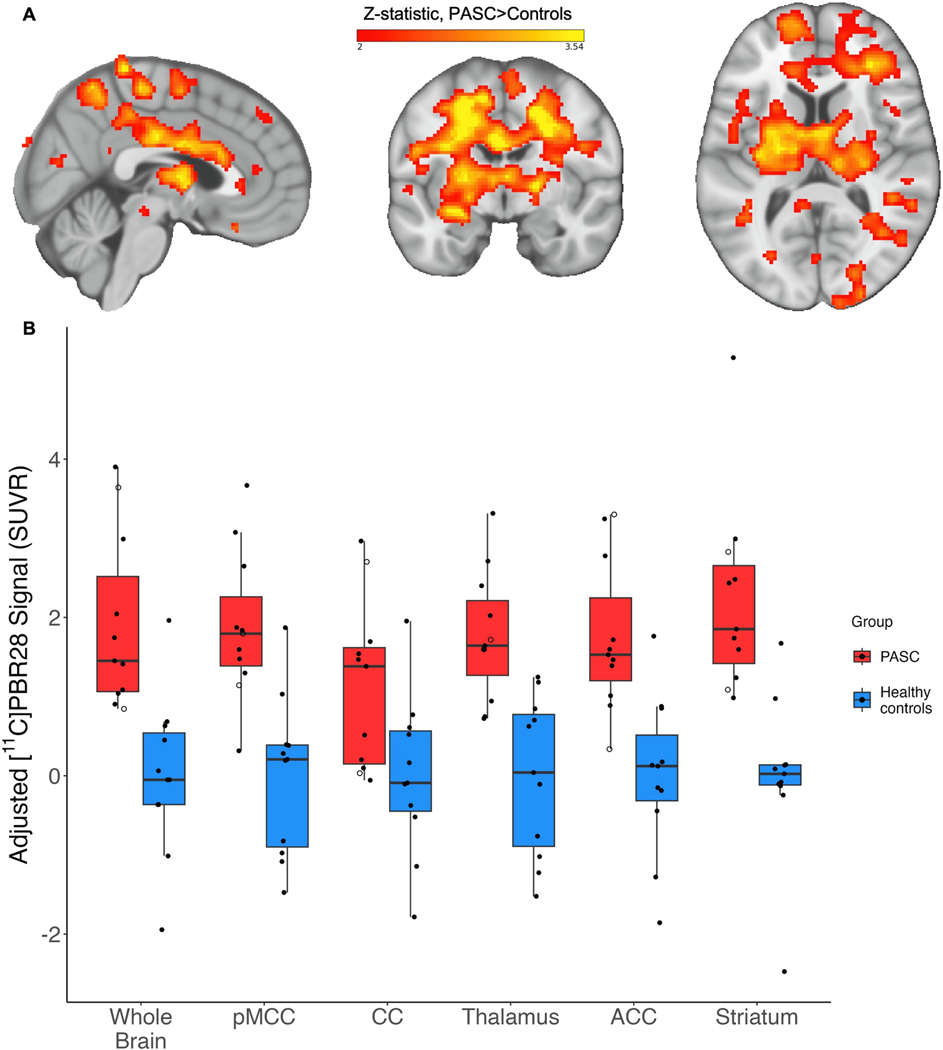
Fig. 2.
To validate our primary results, we performed a second analysis using a paired approach in which each PASC participant was matched to a control participant for genotype, sex, and age ±5 years. Because no control participant fit these criteria for one PASC participant, they were left out of the paired validation analysis. Genotype and sex were directly matched; neither age nor cerebellum SUV nor injected dose differed between cases and controls (p > .05). (A): Example slices through sagittal (x = 3), coronal (y = −7), and axial (z = 10) sections of the 11 PASC > 11 control group-level unpaired validation comparison, showing the statistically significant pattern of increased [11C]PBR28 signal. (B): Individual PET signal data depicted as described for Fig. 1B. Color bar: threshold min. Z score of 2 and max. 3.54. (Figure is shown in neurological convention).

