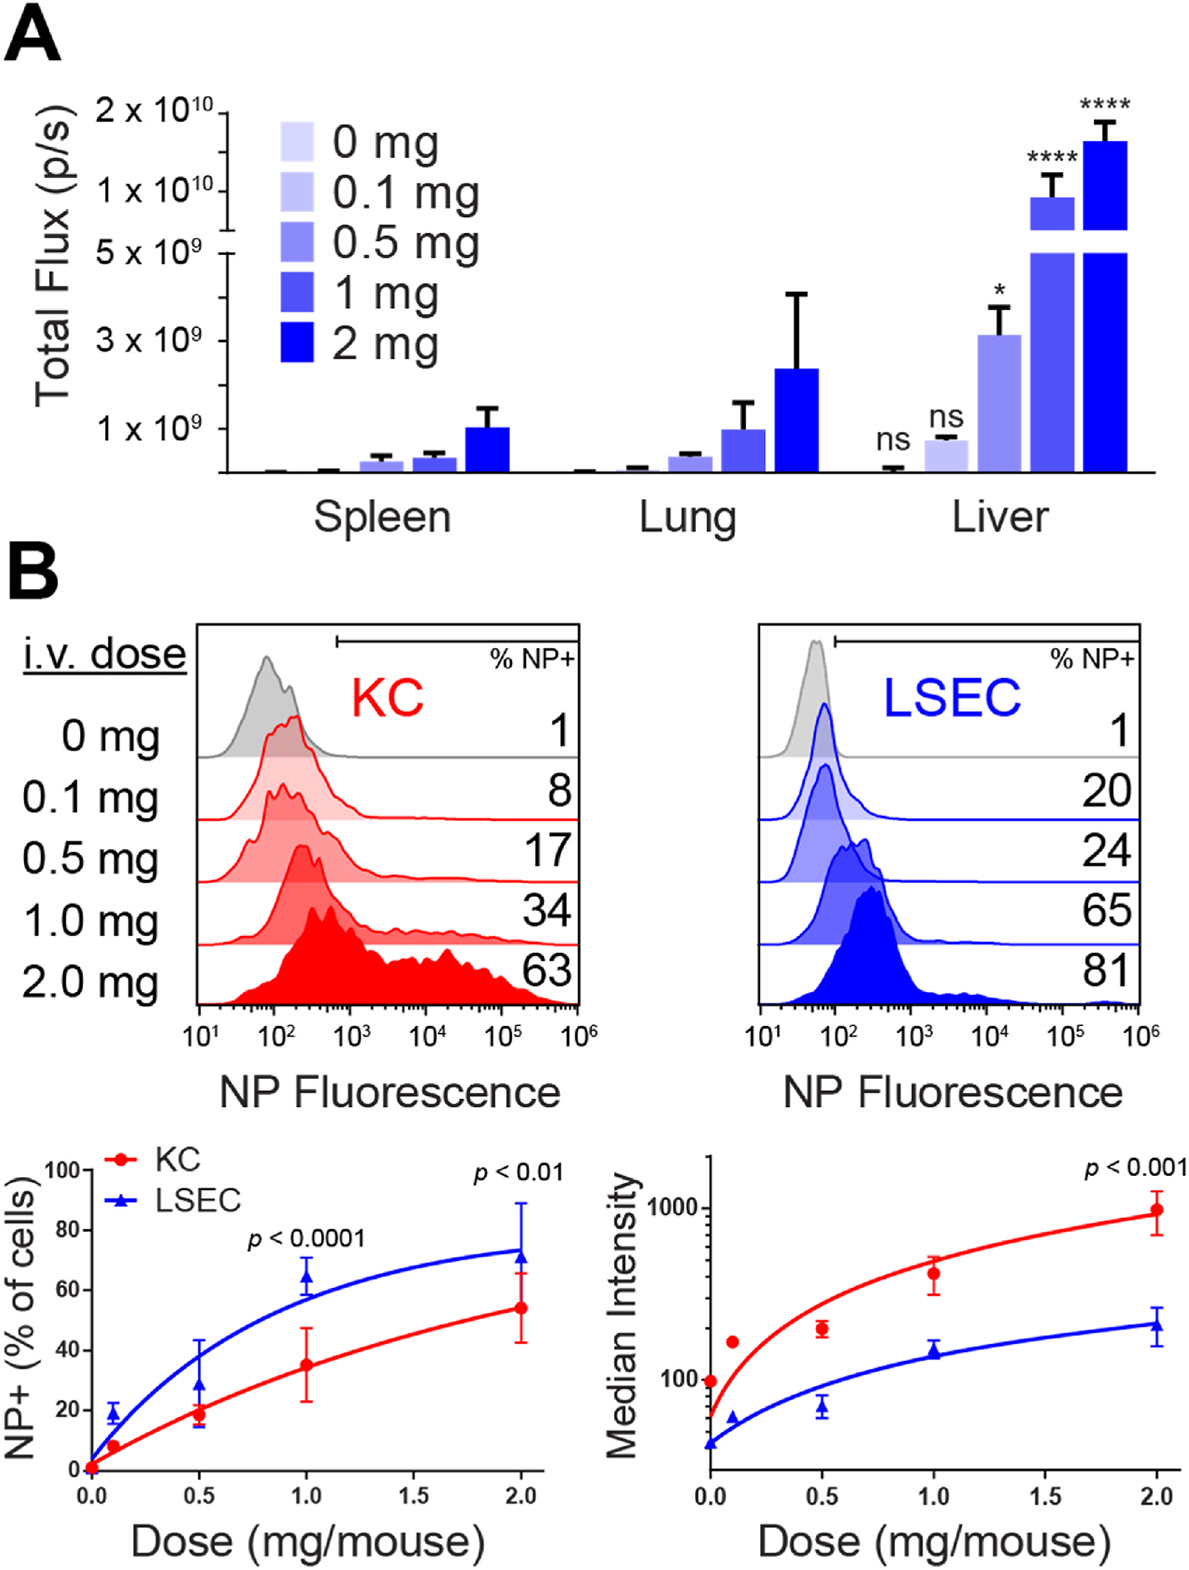
Fig. 1.

PLG nanoparticles distribute to KCs and LSECs in the liver. PLG-Cy5.5 were intravenously injected into C57BL/6 mice (n = 3) over a range of doses from 0 to 2 mg per mouse. (A) At 24 h, the mice were euthanized and PLG-Cy5.5 fluorescence was quantified in the spleens, lungs, and livers by IVIS imaging. (B) The frequency of PLG-Cy5.5 association with KCs and LSECs and median fluorescence intensity was measured by flow cytometry. At each dose in (A), statistical differences between the liver and the lung and spleen were determined using a two-way ANOVA with Tukey’s multiple comparisons test (*p < 0.05, ****p < 0.0001). Comparisons between KCs and LSECs (B) were determined by two-way ANOVA with Sidak’s multiple comparisons test. Error bars indicate SD and data are representative of 2 independent experiments.
