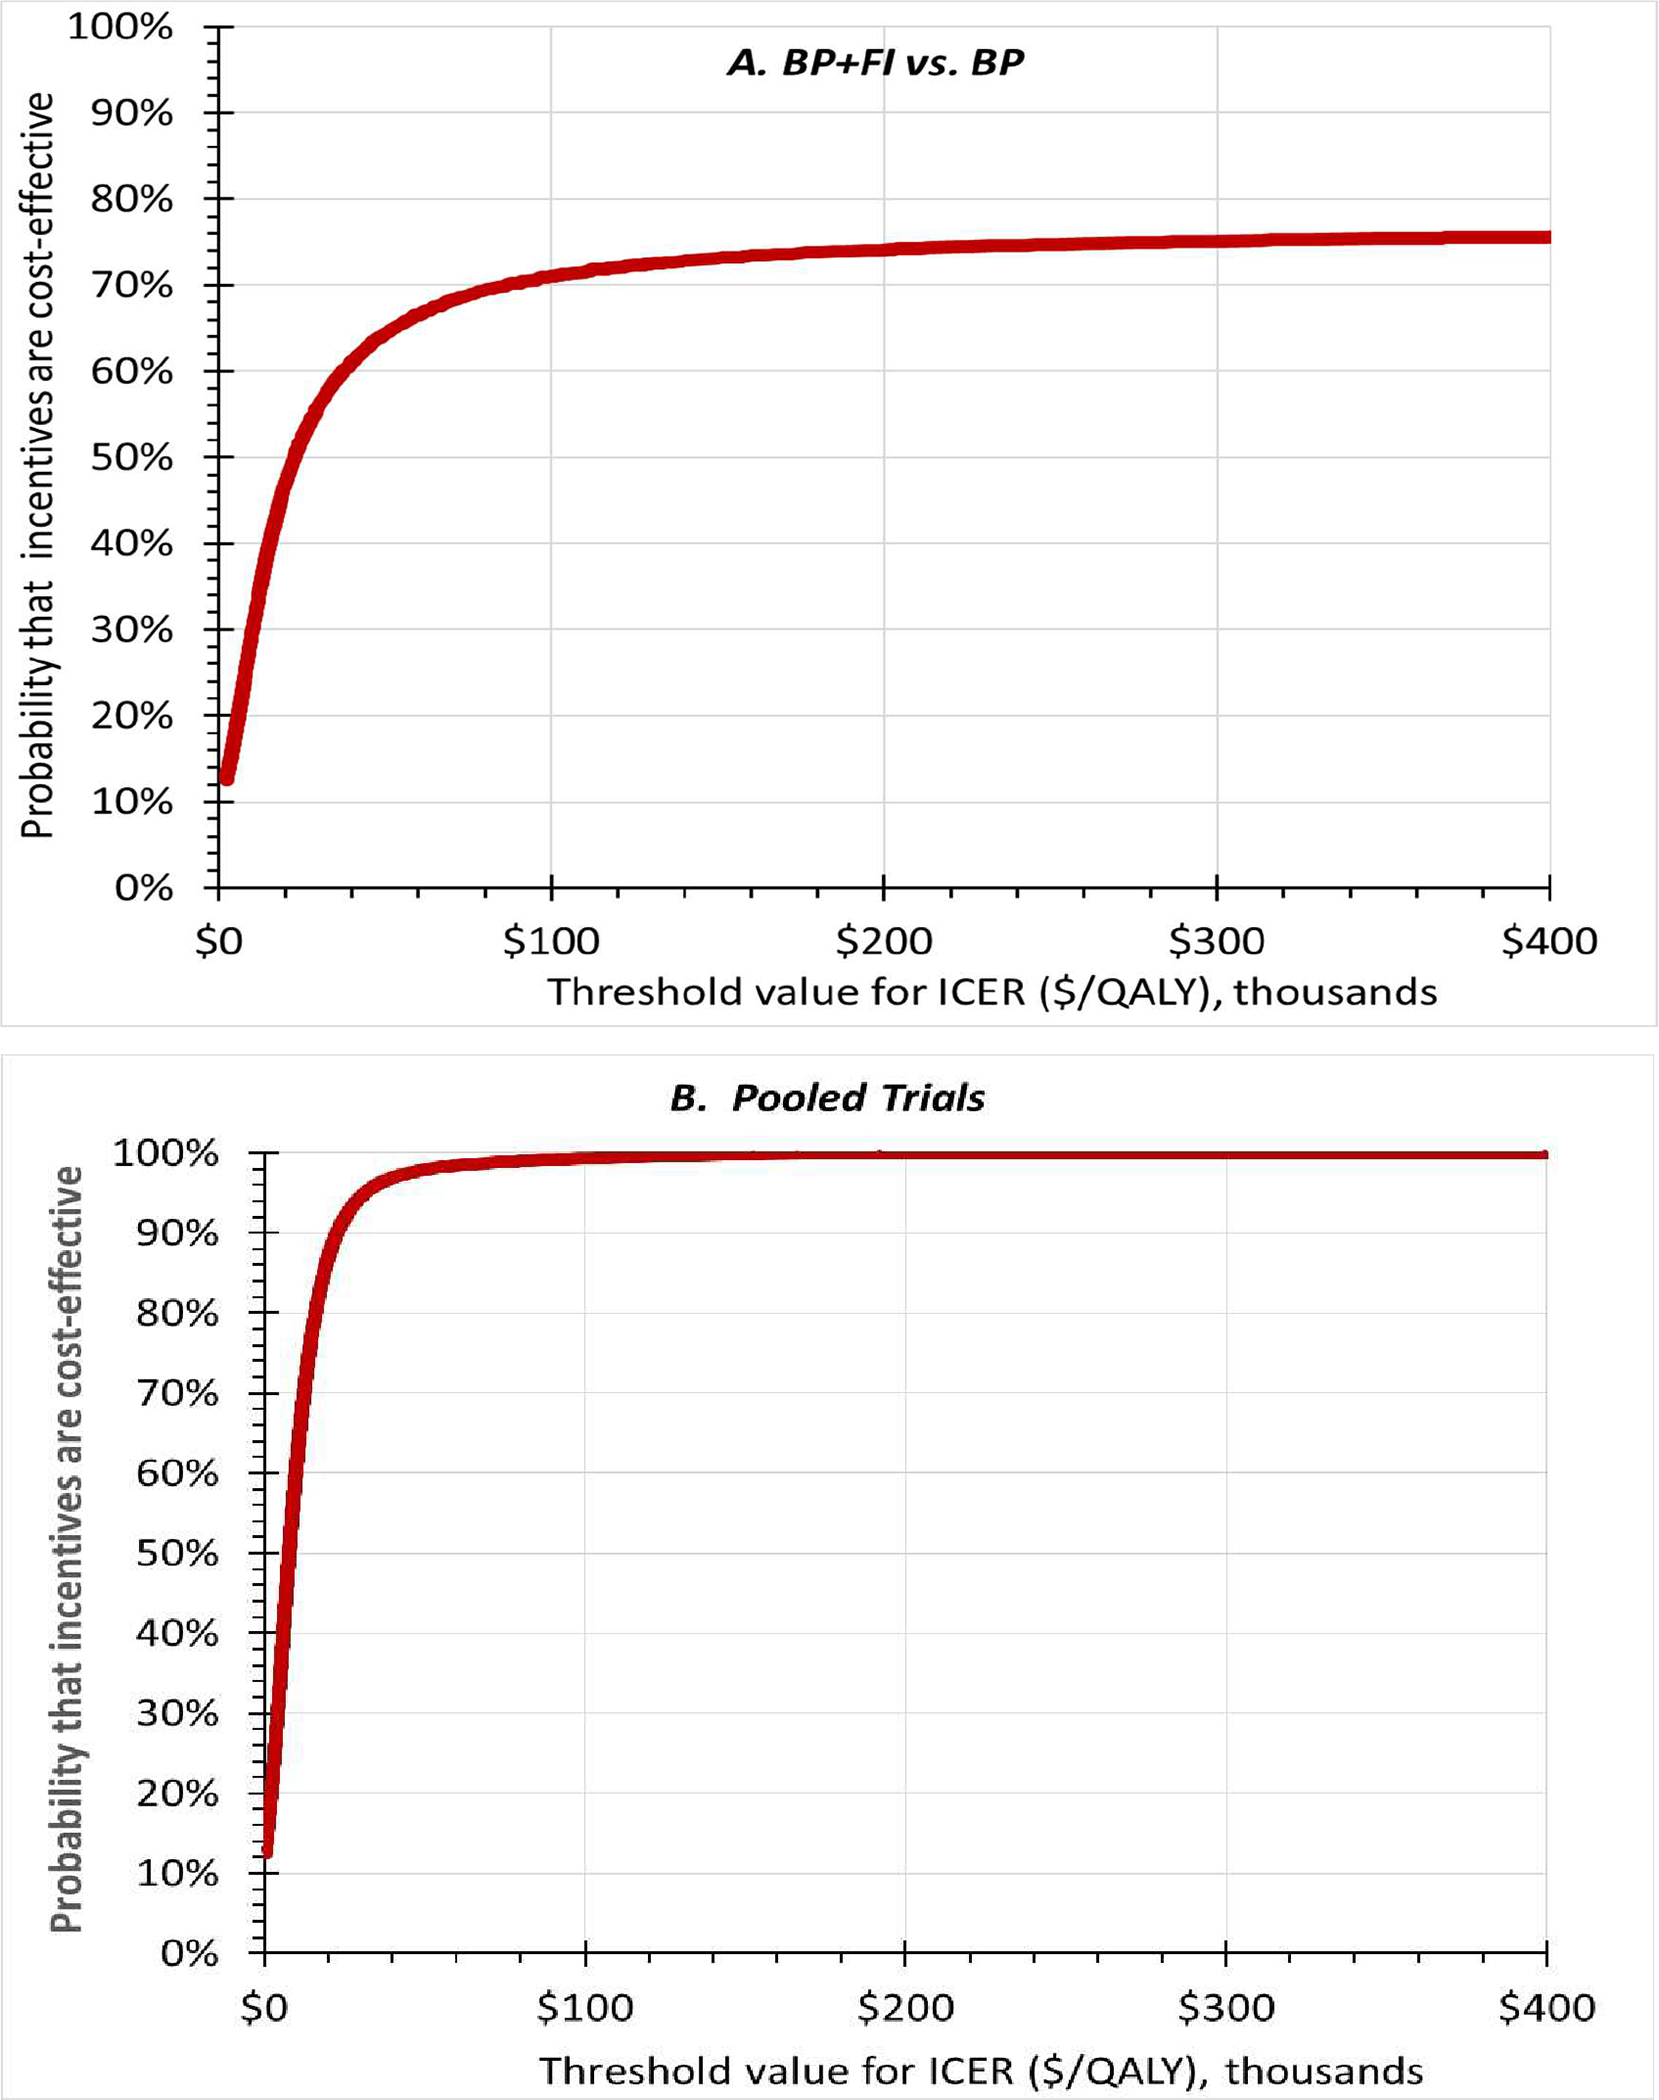
Figure 1.

Cost-effectiveness acceptability curves for the BP+FI vs. BP (panel A) and in the pooled trials (panel B). X-axes show alternative thresholds for cost-effectiveness. Y-axes shows the probability that incentives were cost-effective at that threshold. The curves slope upwards, showing that the higher the threshold, the more likely the intervention will be considered cost-effective.
