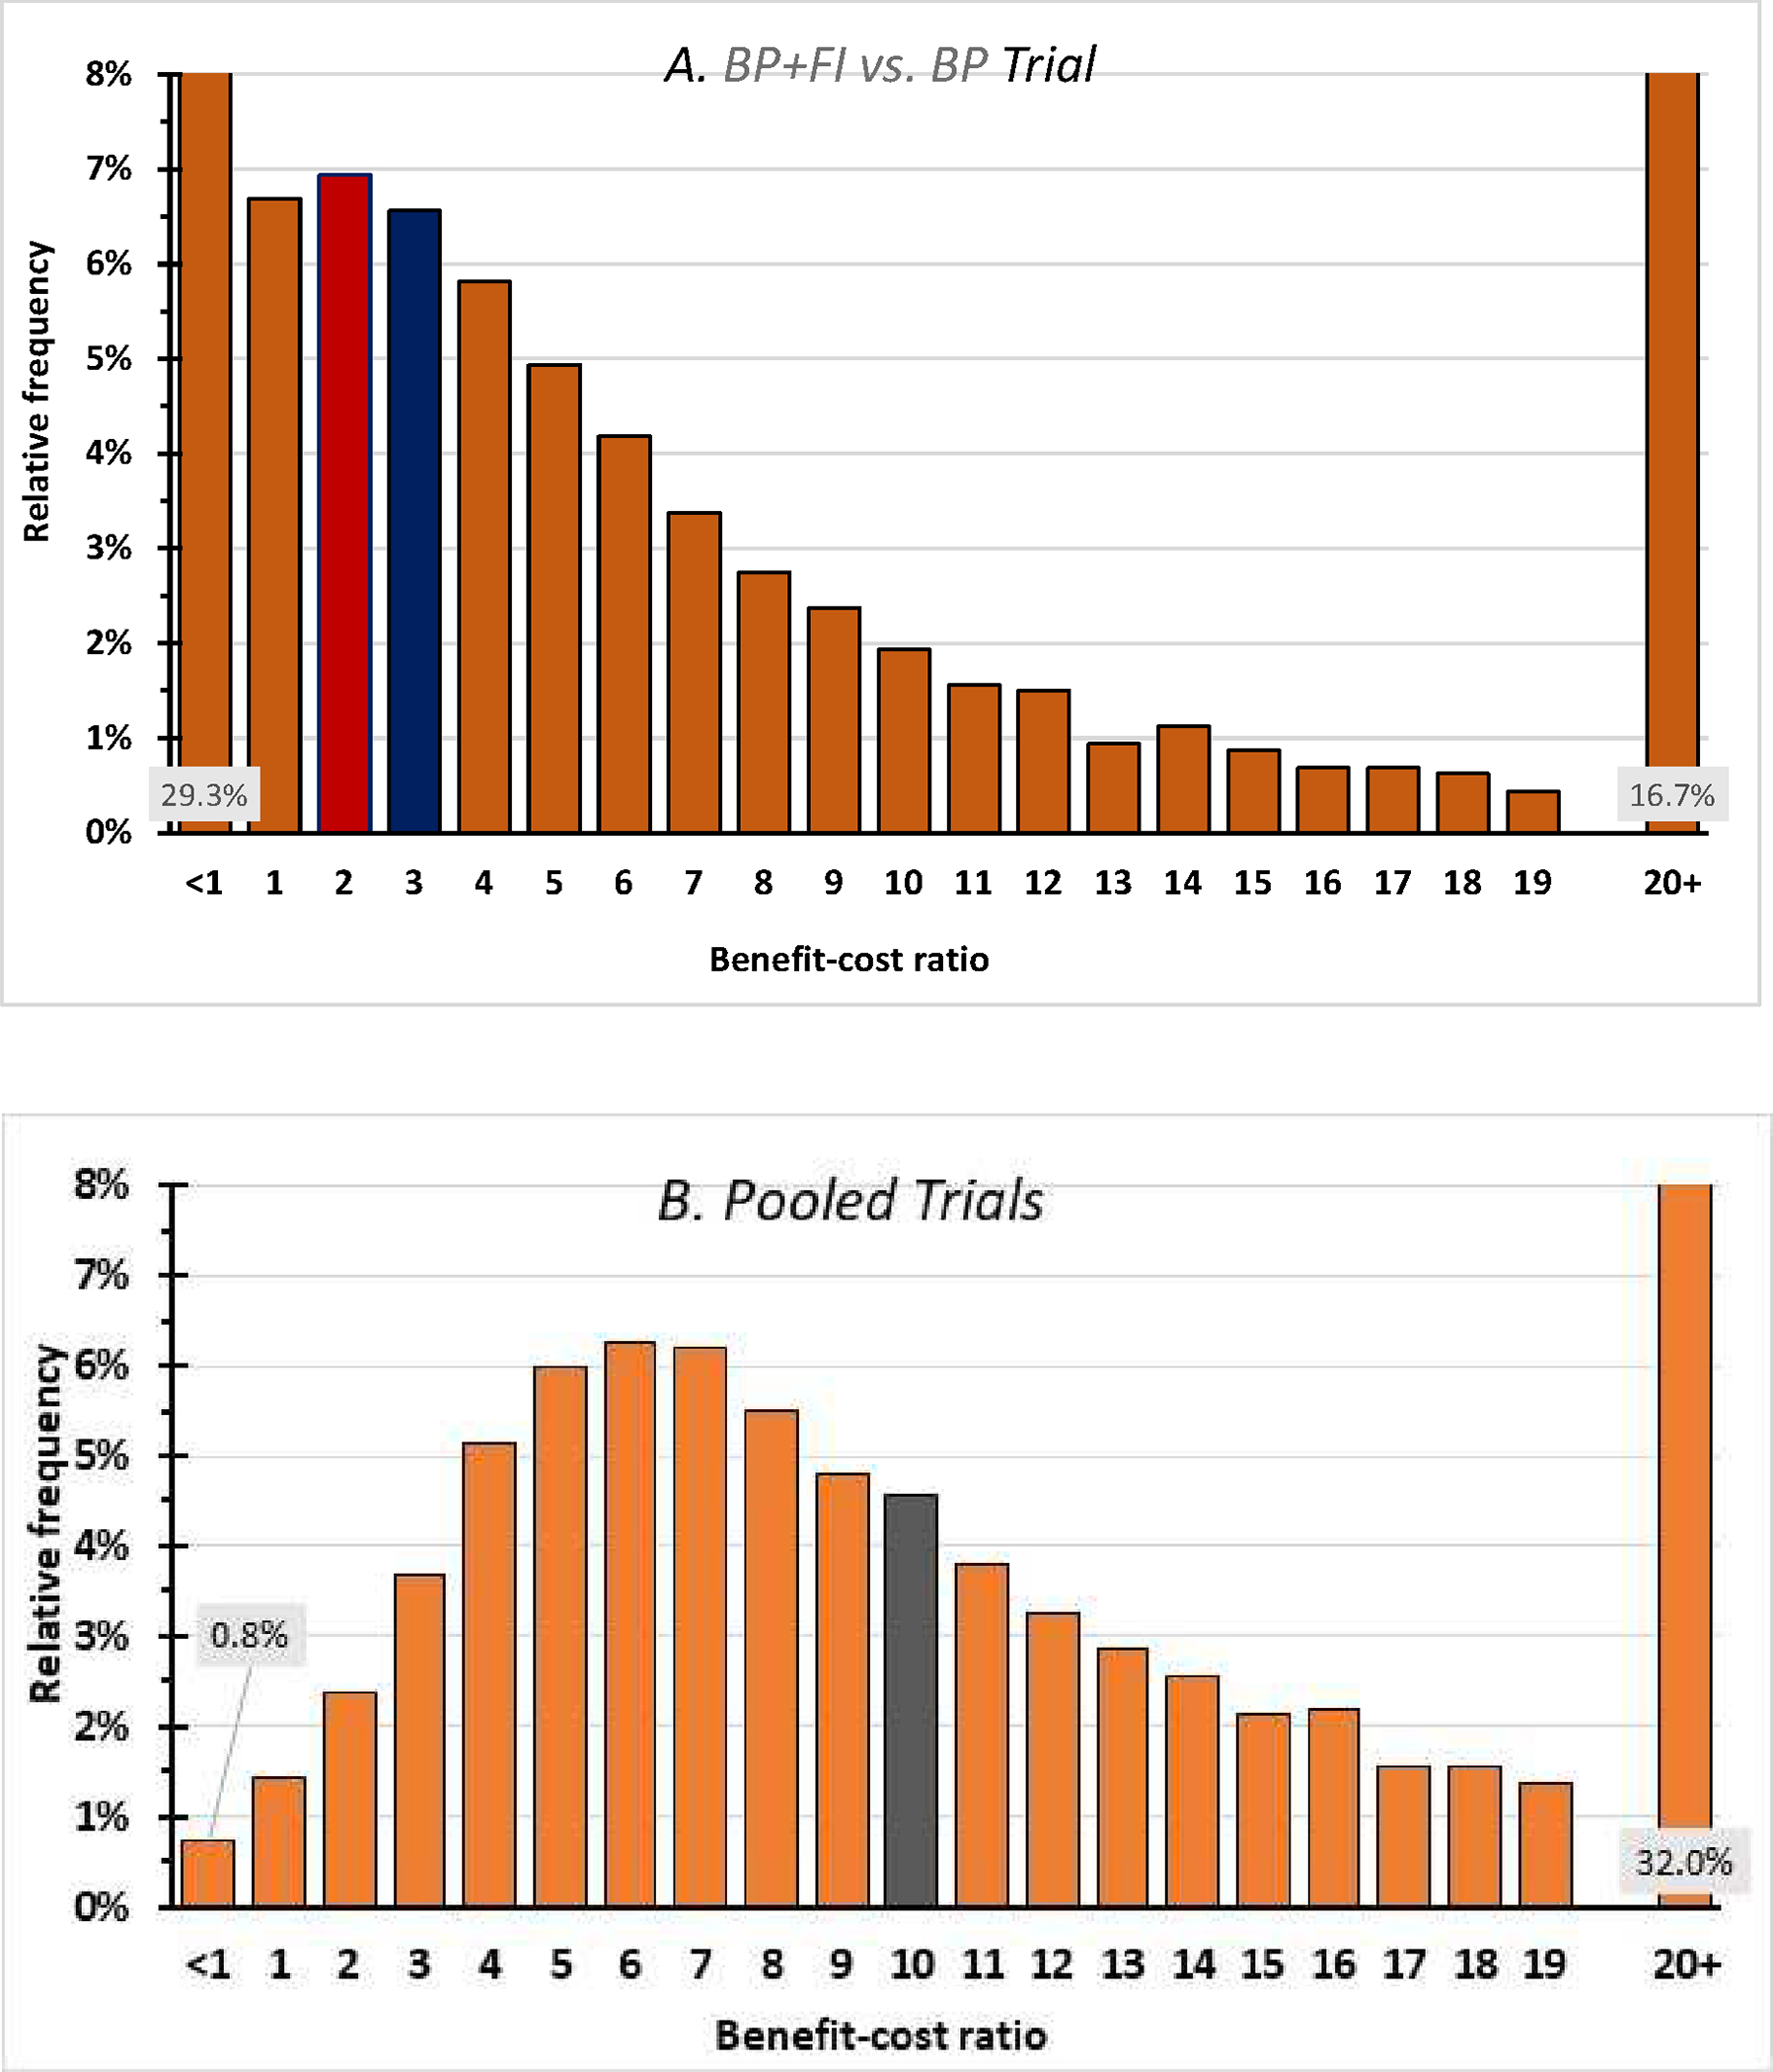
Figure 2.

Frequency distribution of benefit-cost ratios. The central values of the benefit-cost ratio were 4.20 in the BP+FI vs. BP trial (panel A) and 11.90 in the pooled trial (panel B). The median values (with bars shaded) are 2.70 and 10.65 respectively. The left-most bars corresponding to a benefit-cost ratio below 1 indicate the probabilities that incentives were not cost-beneficial. These probabilities were 29.3% in the BP+FI vs. BP trial and 0.8% in the pooled trials. The right-most bars indicate the probabilities that incentives had a benefit-cost ratio of 20 or above, indicating an extremely favorable benefit-cost ratio, were 16.7% in the BP+FI vs. BP trial and 32.0% in the pooled trials. Each top category incorporates the 12.5% probability that incentives are cost-saving.
