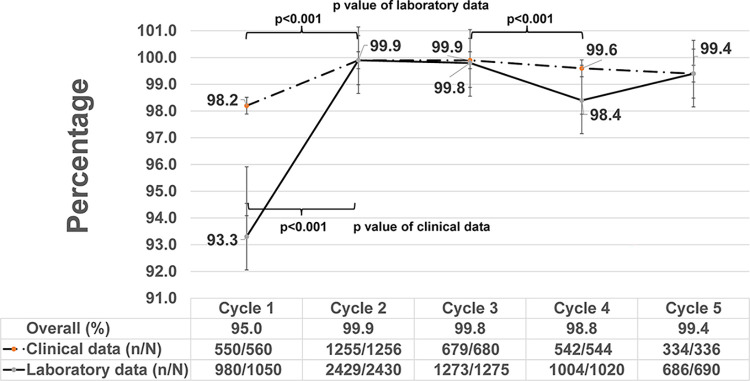
Fig 3. Completeness of laboratory and clinical data by data audit cycle, EGASP Thailand, 2015–2021.
Comparison of source document and database completeness over the course of the pilot surveillance project from 2015–2020 (Cycle 1: 11/2015–6/2016, Cycle 2: 7/2016–11/2017, Cycle 3: 12/2017–10/2018, Cycle 4: 11/2018–10/2019, and Cycle 5: 11/2019–12/2020). Completeness was calculated as the proportion of data elements from source documents and surveillance database that were complete (no missing data in either source documents or database, n) compared to all elements reviewed during the audit (N), for data from the clinical encounter (clinical data), laboratory workup (laboratory data), and clinical/laboratory combined (overall). The trend in completeness of clinical (dashed line) and laboratory (solid line) data are shown over the surveillance period (cycles 1–5) with 95% confidence intervals (vertical bars).

