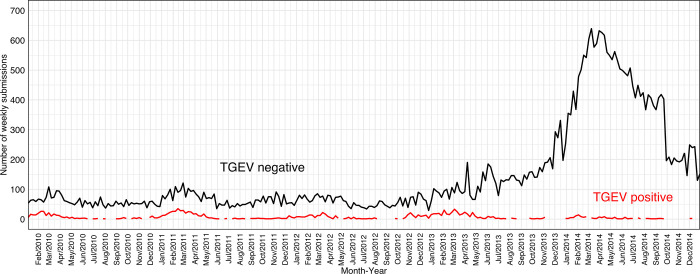
Fig 1. Time-series of transmissible gastroenteritis virus (TGEV) polymerase chain reaction (PCR) results from 2010 through 2014.
The black line represents the number of submissions with TGEV PCR-negative results while the red line represents the number of submissions with a TGEV PCR-positive result. The blue rectangle indicates the first peak on TGEV-negative submissions on week of April 8th, 2013.

