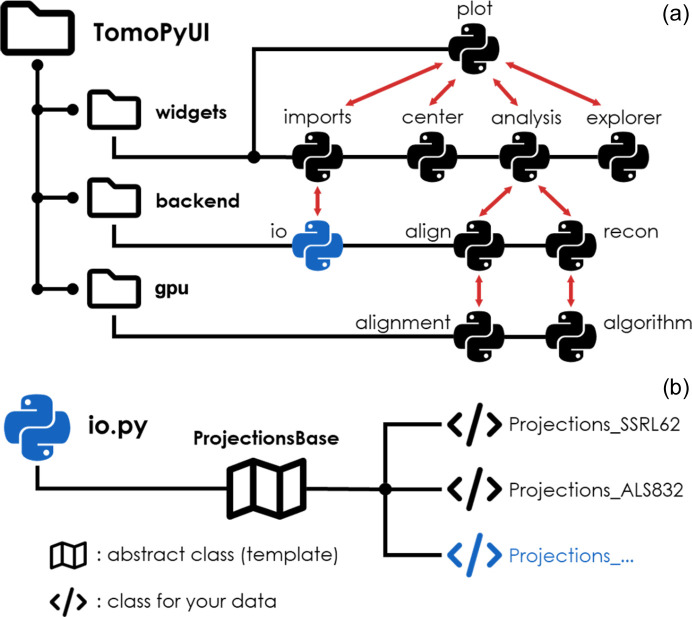
Figure 6.
(a) Structure of TomoPyUI. The submodules of the code interact (shown by the red arrows) to create the GUI. The Python symbols indicate individual Python files, and the black lines indicate their subfolder (i.e. widgets, backend and gpu). (b) Scalability to other beamlines. Only minor modifications need to be made to a selection of the Python files (e.g. io.py shown in blue) to add import functionality for specific beamlines. Figure created using FontAwesome Free icons, creative commons license CC BY 4.0 (https://fontawesome.com/license/free).

