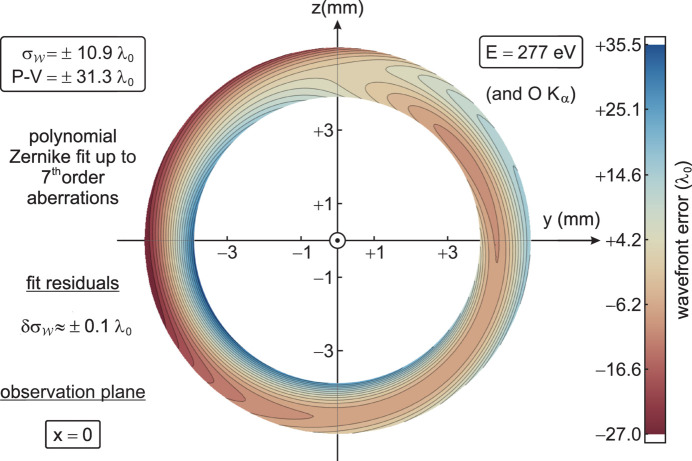
Figure 5.
Retrieved wavefront error  on the annular cross-section of the beam at x = 0, i.e. in the optical centre of the ellipsoid (Fig. 1 ▸), in units of λ0 at 277 eV. Five different CCD image pairs within 210 mm ≤ Δx ≤ 250 mm are analysed with the algorithm (Figs. 2 ▸ and 3 ▸). The averaged data are fitted by means of a Zernike expansion (Fig. 6 ▸) up to seventh-order aberrations, with an r.m.s. value
  =
=  . See also the movie in the supporting information.

