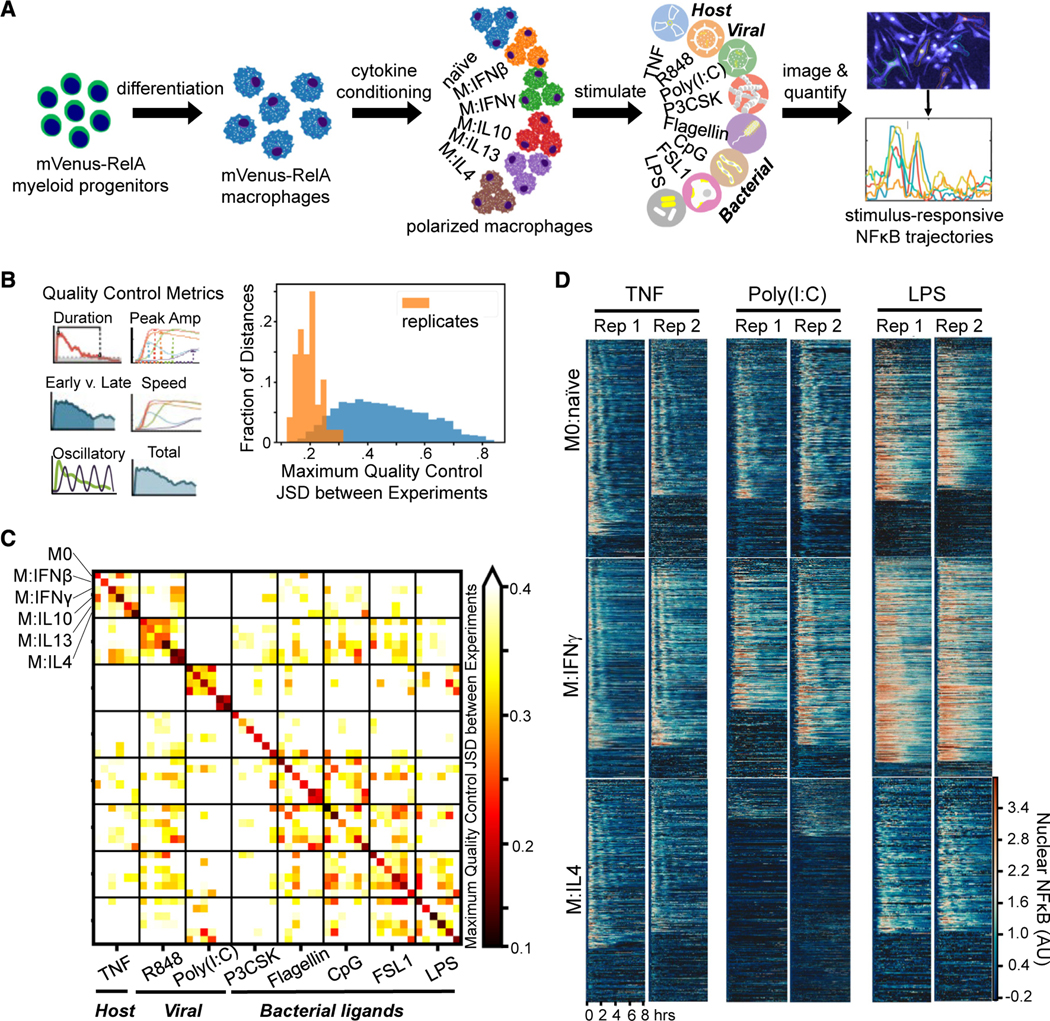
Figure 1. Single-cell NF-κB trajectories across 6 polarization states following 8 different stimulations.

(A) Experimental pipeline for obtaining single-cell NF-κB responses in different polarization and stimulation conditions to study the effect of polarization on stimulus responses.
(B) Histogram of maximum Jensen-Shannon distance (JSD) between distributions of quality control (QC) metrics from experiments, with distances between replicate experiments in orange and distances between different experimental conditions in blue.
(C) Along the diagonal of the distance matrix are the maximum QC JSD between replicates for each experimental condition. Experimental conditions are ordered by stimuli and further sub-ordered by polarization state. The off-diagonal elements are the maximum QC JSD between replicates of different experimental conditions. Maximum of color bar set to 0.4 to focus on smaller distances.
(D) Example replicate NF-κB trajectory datasets in M0, M:IFNγ, and M:IL-4 polarization states with TNF, poly(I:C), and LPS stimulation. Each row in a heatmap corresponds to a single macrophage in the experiment, and the color corresponds to the amount of nuclear (active) NF-κB.
