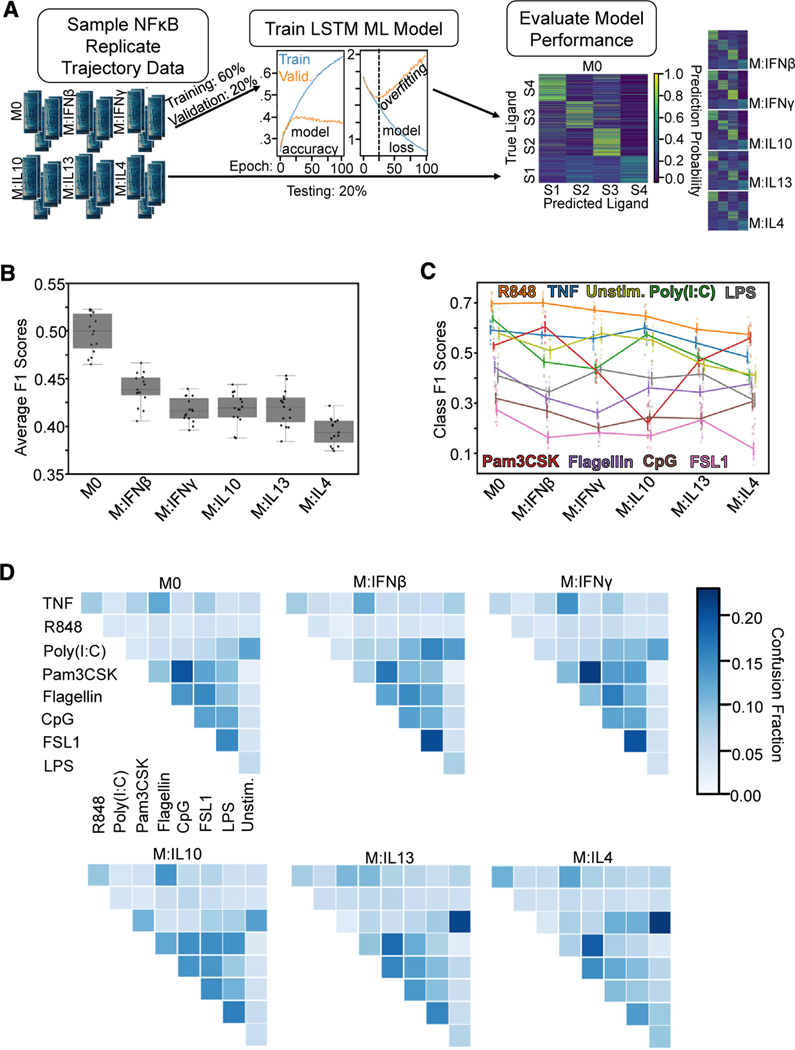
Figure 2. An LSTM-based ML classifier reveals decreased stimulus-response specificity with macrophage polarization.
(A) For each classification task, data were sampled from all polarization states to train and test the LSTM ML model. Input data were split into training (60%), validation (20%), and testing sets (20%), where validation loss was used to monitor model overfitting.
(B) Macro-averaged class F1 score for the task of classifying each ligand (including unstimulated) across polarization states demonstrates loss of stimulus-response specificity with polarization.
(C) Class F1 scores across polarization states from the same model as in (B).
(D) Confusion fractions across polarization states for different ligand stimulations reveal polarization-dependent patterns in stimulus-response specificity. Error bars in (C) correspond to 95% confidence intervals with n = 15.

