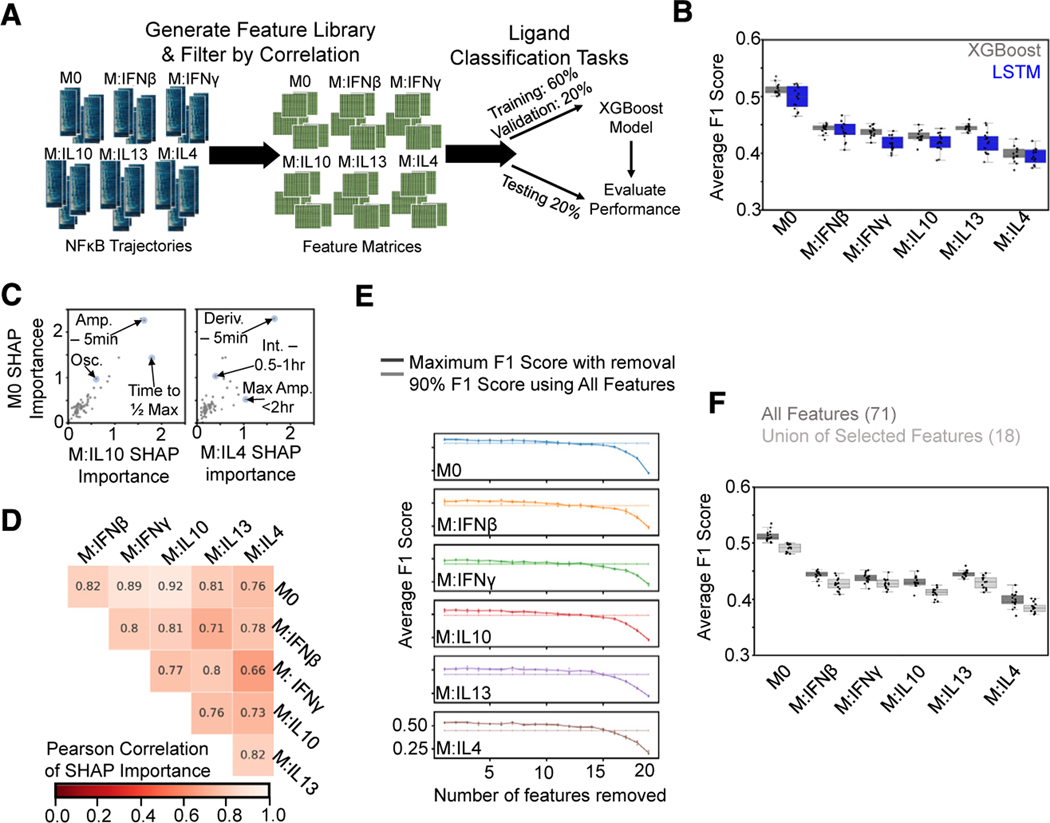
Figure 3. A feature-based ML classifier recapitulates LSTM results and reveals features informative for specificity.
(A) A set of features was derived from the NF-κB trajectories, and the resulting feature library was used to train and test XGBoost classifiers on ligand discrimination tasks.
(B) Comparison of macro-averaged class F1 scores for the task of classifying ligands across polarization states for XGBoost and LSTM models reveals similar drop in performance with polarization.
(C) Comparison of mean absolute SHAP values summed over classes for M0 model versus IL-10 and IL-4 models from XGBoost models trained independently for each polarization state on the task of classifying ligands (Amp., amplitude; Deriv., derivative; Int., integral; Osc., oscillatory).
(D) Pearson correlation of mean absolute SHAP values summed over classes between different polarization models.
(E) Maximum macro-averaged F1 score obtained as features are removed from the set of top 20 features returned by the SHAP analysis for each polarization state. Model performance deteriorates once 14–15 features are removed; hence, 6–7 features are retained. Solid line with increased transparency displays threshold of 90% macro-averaged F1 score using all features for training.
(F) Comparison of XGBoost model macro-averaged F1 score when trained across all polarization states using all features (same model as in B) versus union of the selected features. Error bars in (E) correspond to 95% confidence intervals with n = 15.

