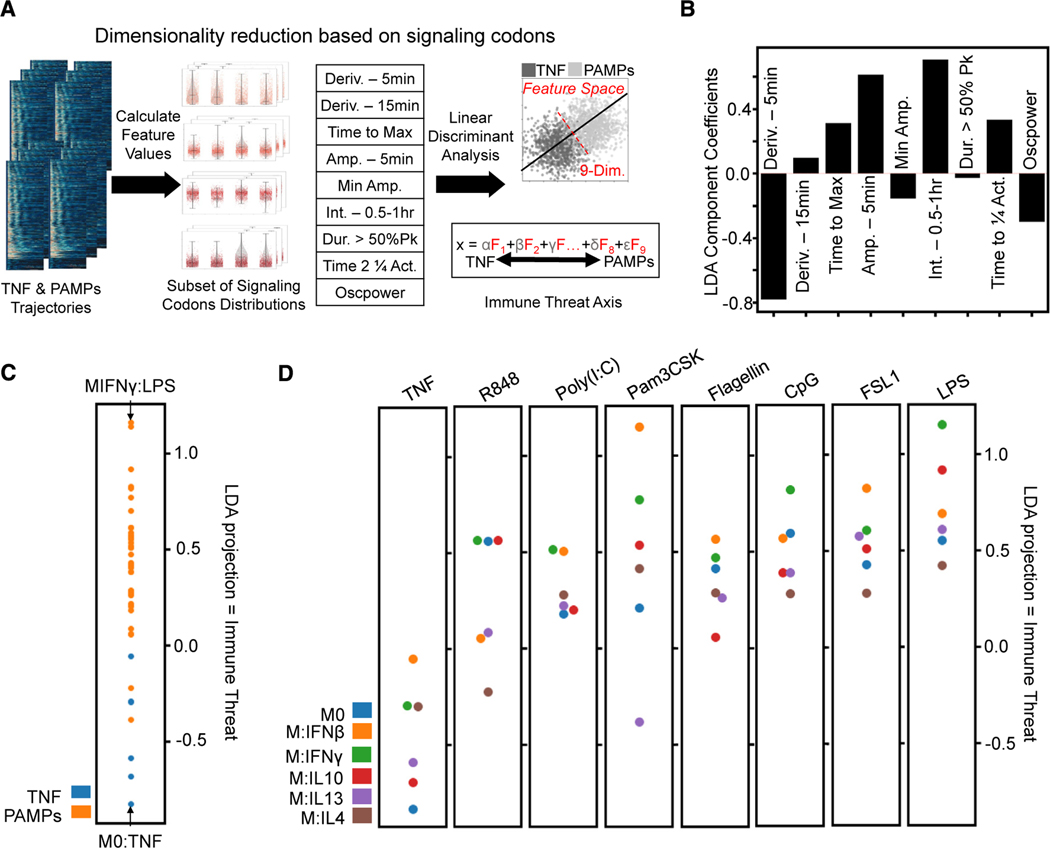
Figure 4. Characterization of informative features by immune threat.
(A) The subset of signaling codons is calculated from the single-cell NF-κB trajectories, and then LDA finds a linear combination that best distinguishes threat level (host TNF versus PAMP responses). Upsampling the smaller host TNF class to balance the classes gave an overall accuracy of approximately 68% for this binary classifier (Deriv., derivative; Amp., amplitude; Int., integral; Act., activity).
(B) Coefficient applied to each informative feature to obtain the LDA projection, hence characterizing immune threat: decreased 5-min derivative, increased time to max, increased 5-min amplitude, increased 2nd half-hour integral, increased time to quarter total activity, and decreased oscillations.
(C) Comparing mean LDA projection of host TNF versus pathogen (PAMPs) responses; this axis quantifies immune threat as pathogen responses are more positive along it.
(D) Comparing mean LDA projection of different polarizer responses for each stimulation condition shows more M1-polarized responses with positive LDA values and more M2 polarized responses with negative LDA values.

