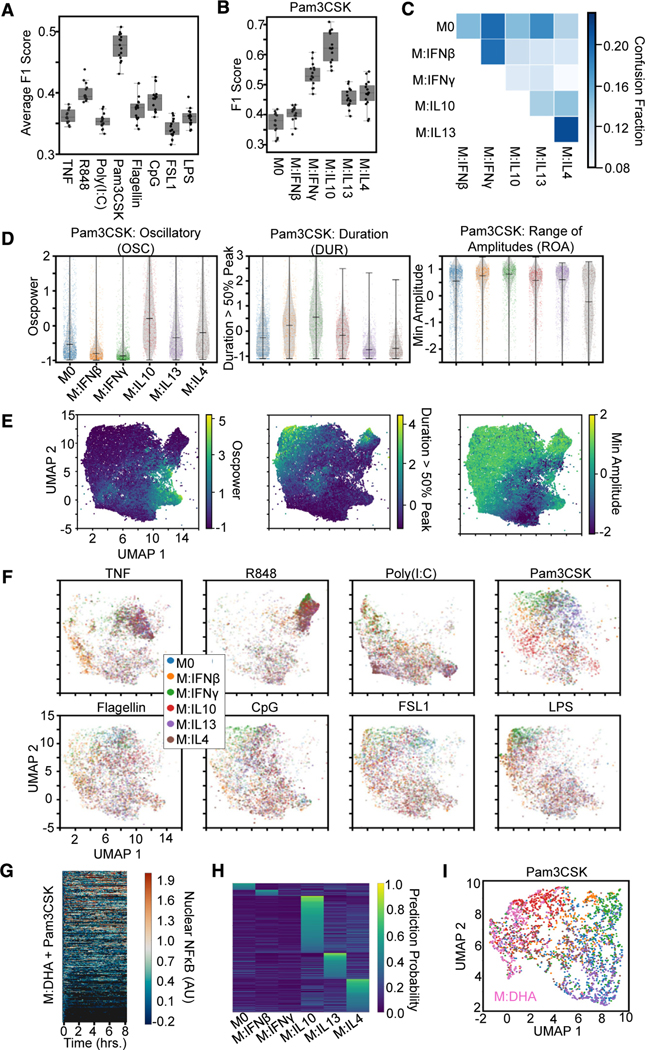
Figure 6. Mapping macrophage polarization states with NF-κB signaling response dynamics.
(A) Macro-averaged class F1 scores from an XGBoost model trained (using the library of 71 features) for the task of classifying each polarizer across stimulation conditions provide a quantification of polarizer distinguishability for each stimulus.
(B) F1 scores for Pam3CSK stimulation responses reveal identification of IFNγ and IL-10 drive distinguishability.
(C) Confusion fractions highlights distinguishability of IL-10.
(D) Distributions for top 3 informative feature from the single-cell responses to Pam3CSK across all polarization conditions. Oscillatory values separate IL-10 from other M2 polarizers and M1 polarizers from the other states. Duration values separate IL-13 and IL-4 from other states and slightly separate IFNβ from IFNγ. Minimum amplitude separates IL-13 from IL-4.
(E) Uniform manifold approximation and projection (UMAP) of all NF-κB responses (sampled such that number of cells per condition is equivalent, 1,338) using the top 10 features identified by SHAP analysis colored by feature values.
(F) UMAP of the NF-κB responses (same as in E) split by each stimulus colored by polarization state.
(G) Single-cell nuclear NF-κB trajectories from hMPDMs pretreated with docosahexaenoic acid (DHA) and stimulated with Pam3CSK.
(H) Single-cell classification probabilities for DHA-pretreated Pam3CSK-stimulated macrophages from XGBoost model trained on polarized Pam3CSK responses defined by the top ten features identified in the polarization classification task.
(I) UMAP of Pam3CSK-stimulated response colored by polarization states (colors same as F) or pretreated with DHA.

