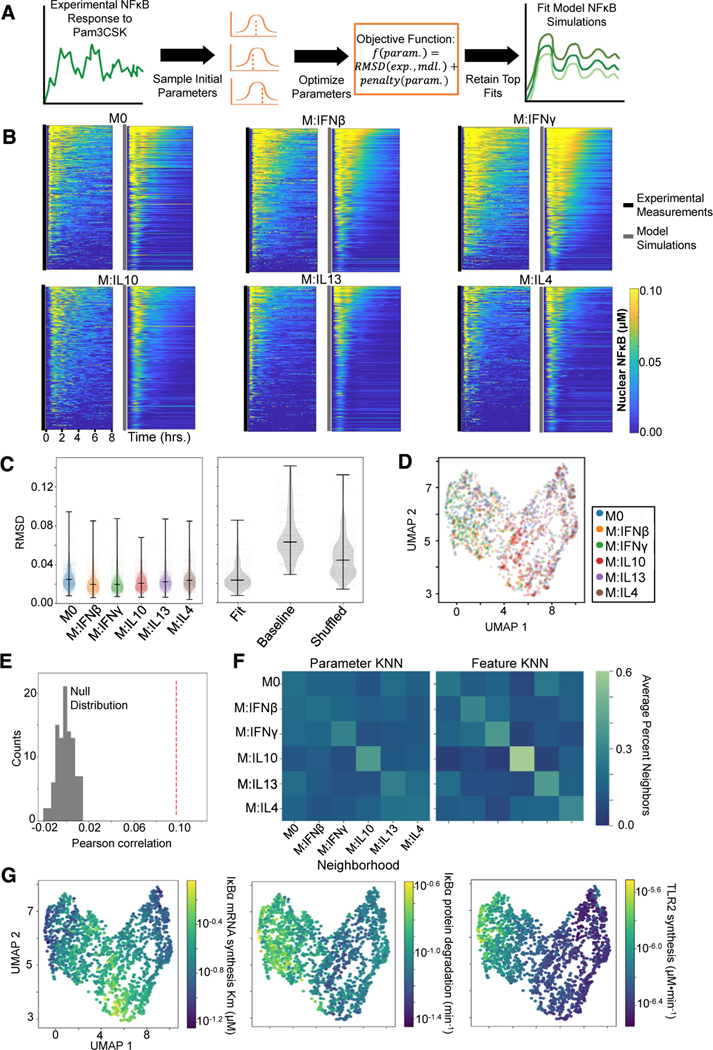
Figure 7. Characterizing macrophage polarization states with inferred biochemical parameters.
(A) General pipeline for obtaining model parameter fits for a single-cell NF-κB response to Pam3CSK consists of randomly initializing the optimization procedure 100 times and retaining the ten fits with the minimum objective value. This objective function is composed of a root-mean-square deviation (RMSD) term that captures the discrepancy between the experimental (exp.) and model (mdl.) NF-κB trajectory and a penalty term that captures deviation of the parameters (param.) from the published baseline values.
(B) Experimental NF-κB trajectories of 300 sampled cells per polarization state alongside the model simulations corresponding to their best parameter fits.
(C) RMSD between the model simulations resulting from the top 10 parameter fits and the corresponding experimental trajectory across the polarization states (left) and the RMSD between the experimental trajectories and the best-fit parameter model simulations, the baseline published parameter model simulation, and shuffled fit parameter model simulations (right).
(D) UMAP visualization based on biochemical parameter fits of sampled single cells colored by polarization states.
(E) Pearson correlation between cell-cell parameter dissimilarities and feature distances (red dashed line) compared with null distribution of Pearson correlation values computed from permuting the data 100 times.
(F) Average neighborhood composition for each polarization state based off the parameter dissimilarities (left) and feature distances (right). The 15 nearest neighbors were chosen to define the neighborhood for each cell (equivalent to UMAP).
(G) UMAP visualization (as in D) with cells colored with average parameter value across the top ten fits.

