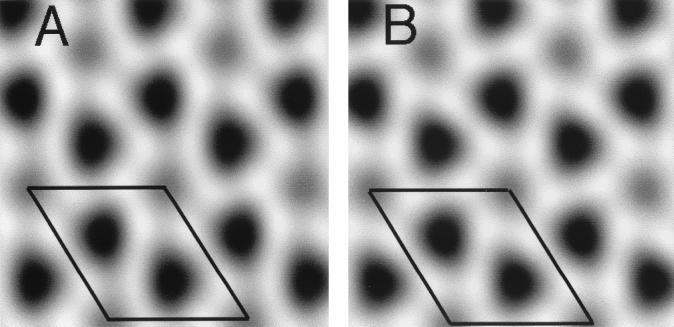
FIG. 7.
Projection reconstructions of membrane-bound His-MoCANC arrays. Ten images of lipid monolayer-bound His-MoCANC arrays were scanned, boxed, Fourier transformed, indexed, CTF corrected, and merged as described in Materials and Methods. Amplitude and phase values for each reflection were vector averaged, after which the averaged values were used in backtransformations to obtain projection reconstructions. Merges were performed assuming no symmetry constraints (p1) (A) or assuming hexagonal (p6) symmetry (B). Images show protein regions as white and protein-free regions as dark. The entire backtransformation grey scale was used in each rendering, and reflections to 25.7 Å were used in reconstructions. The outlined areas indicate unit cells of a = b = 77.2 Å and γ = 120°, and merge statistics are provided in Table 3 and Materials and Methods.

