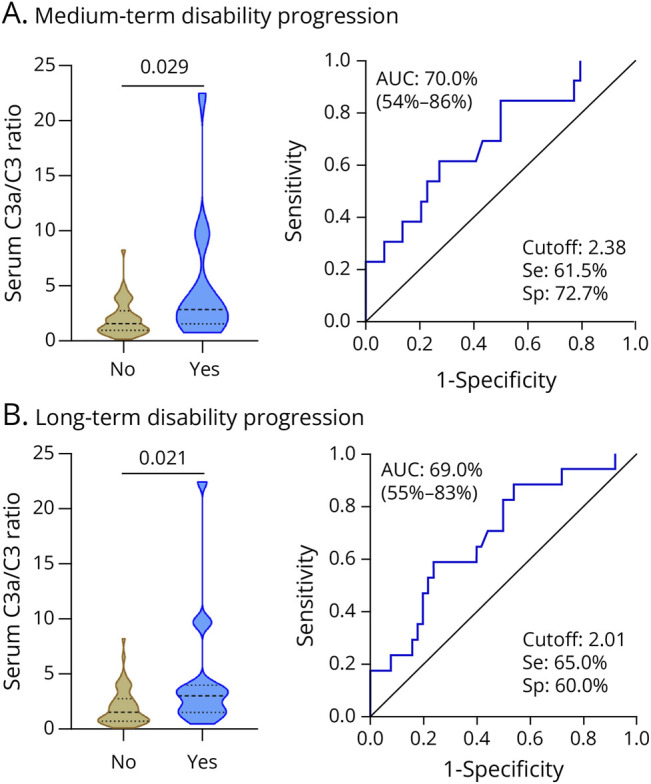
Figure 1. Serum C3a/C3 Ratio in Progressors and Nonprogressors.

Violin plots showing the distribution of the serum C3a/C3 ratio at baseline in progressors and nonprogressors (left graphs), and performance of the serum C3a/C3 ratio to discriminate between progressors and nonprogressors in medium term (A) and long term (B) (right graphs). No: nonprogressors. Yes: progressors. AUC = area under the curve; SE = sensitivity; Sp = specificity.
