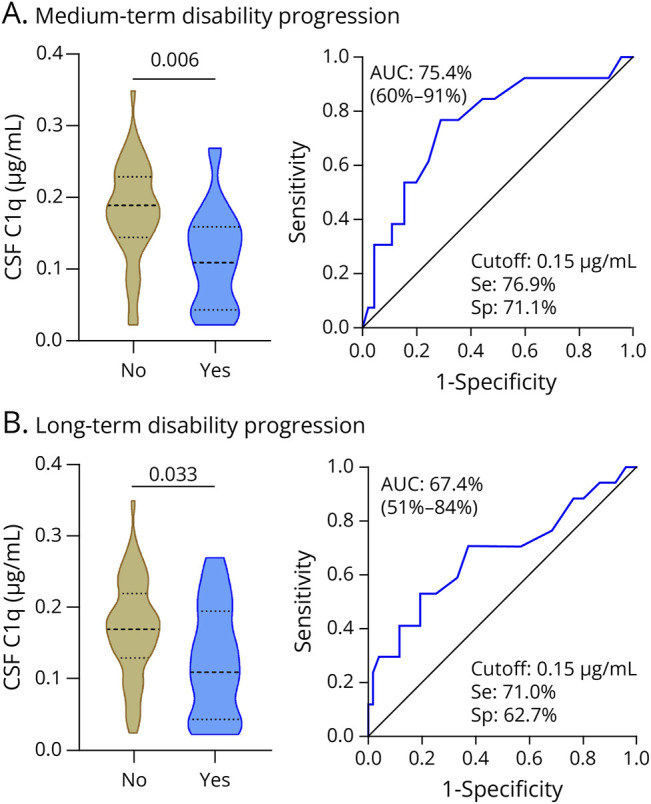
Figure 2. CSF C1q Levels in Progressors and Nonprogressors.

Violin plots showing the distribution of the CSF C1q levels in μg/mL at baseline in progressors and nonprogressors (left graphs), and performance of the CSF C1q levels to discriminate between progressors and nonprogressors in medium term (A) and long term (B) (right graphs). No: nonprogressors. Yes: progressors. AUC = area under the curve; SE = sensitivity; Sp = specificity.
