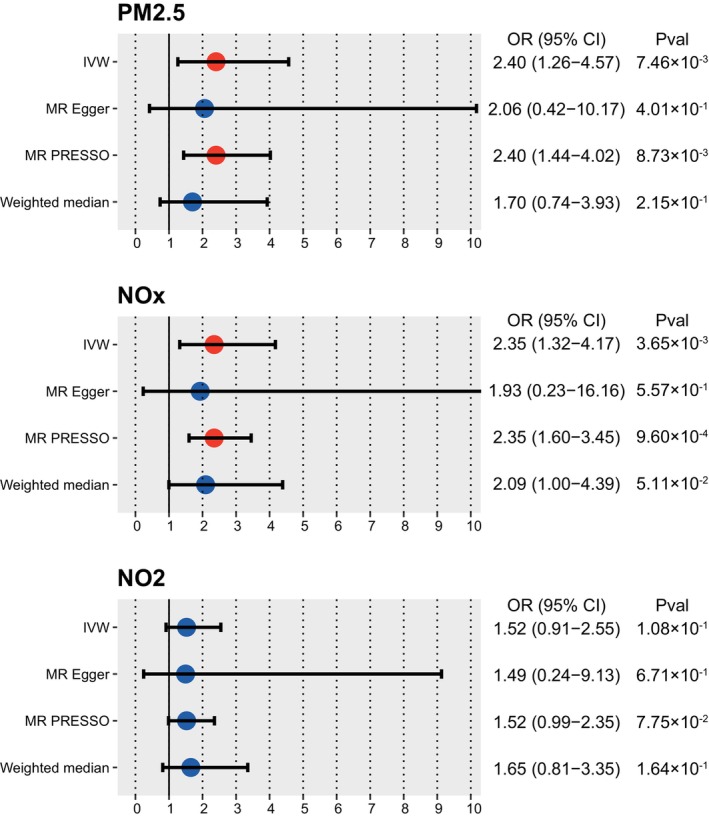
FIGURE 2.

Forest plots illustrating the two‐sample Mendelian randomization (TSMR) estimates of the effects of air pollutants (PM2.5, NOX, and NO2) on the risk of amyotrophic lateral sclerosis (ALS). Each circle represents an individual instrumental variant (IV) with the corresponding odds ratio (OR) and 95% confidence interval (CI) indicated by the horizontal line. The p‐value indicates the statistical significance of the association between exposure and ALS risk. IVW (inverse variance weighting) was used as the primary method, with additional methods (weighted median, MR‐Egger, and Mendelian Randomization Pleiotropy RESidual Sum and Outlier [MR‐PRESSO]) employed as supplementary analyses.
