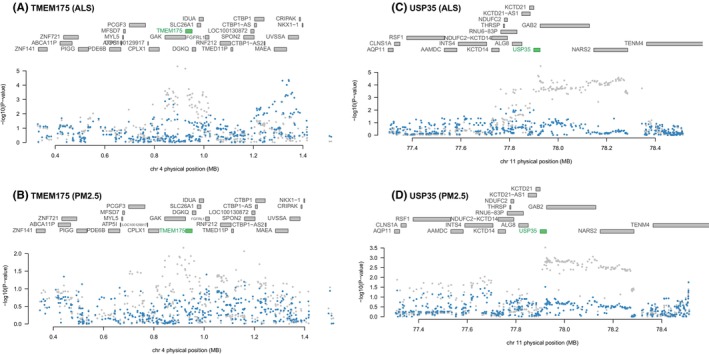
FIGURE 3.

Joint/conditional plots of TWAS. All the genes in the locus were shown in the top panel. The genes that show a marginal association with TWAS are marked in blue, while the genes that exhibit a joint significance are highlighted in green. The lower panel displays a Manhattan plot illustrating the GWAS data before (gray) and after (blue) conditioning on the green genes. The GWAS signals dropped after conditioning the predicted expression of TMEM175(A,B) and USP35(C,D). GWAS, genome‐wide association study; TWAS, transcriptome‐wide association.
