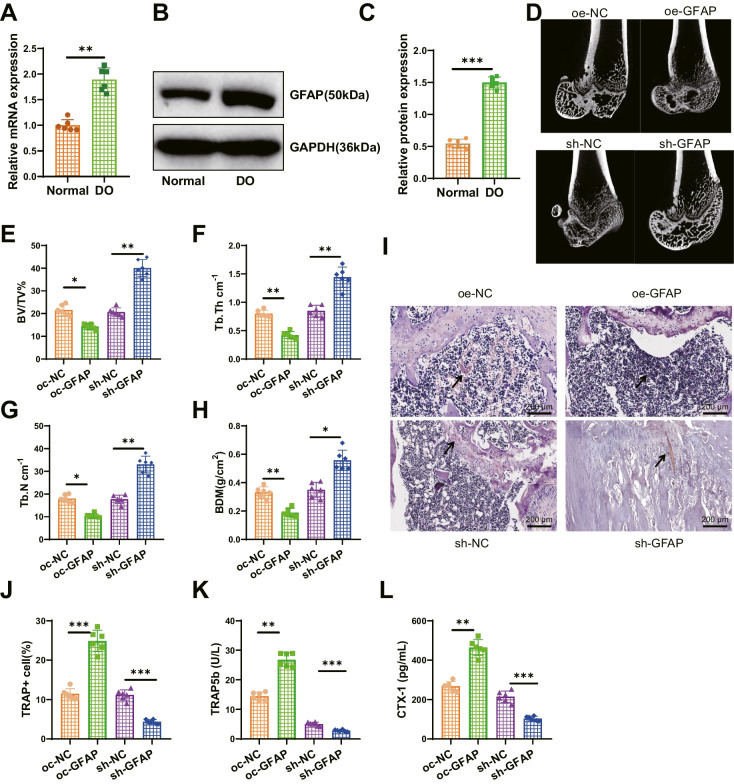
Fig. 3.
Influence of GFAP on osteoporosis in DO rats. Note: (A-B) RT-qPCR (A) and Western blot (B-C) analysis of GFAP expression levels in bone tissues of different groups of rats; (D) Micro-CT analysis of femurs in different groups of rats; (E–H) Statistical analysis of BV/TV, Tb. N, Tb.Th, and BMD in femurs of different groups as shown in panel D; (I) TRAP staining to detect the number of osteoclasts in femoral tissues of different groups, with arrows pointing to positive cells, scale bar = 200 μm; (J) Statistical analysis of the number of positive osteoclast cells shown in panel I; (K-L) ELISA to measure the levels of bone resorption markers TRAP5b (K) and CTX-I (L) in serum of different groups of rats. Each group consisted of 6 rats. * indicates P < 0.05 compared to the control group, ** indicates P < 0.01, *** indicates P < 0.001

