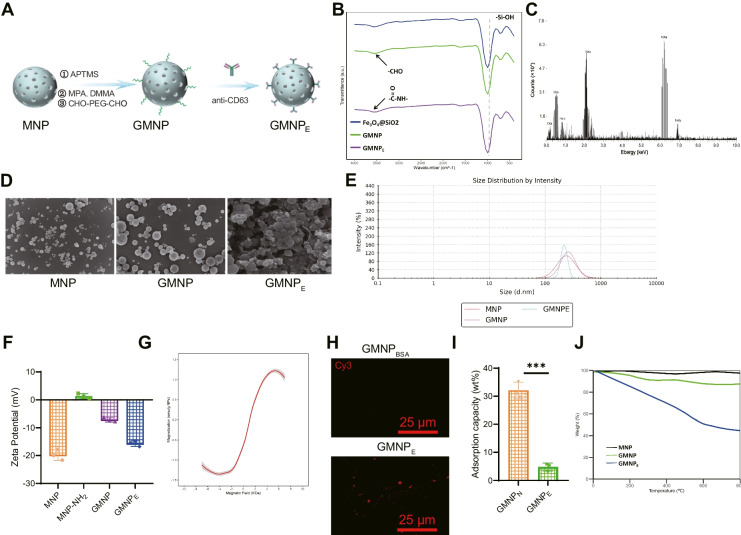
Fig. 5.
Characterization of GMNPE-EVs. Note: (A) Schematic diagram of GMNPE-EVs formation; (B) Infrared spectroscopy analysis of the chemical composition at each step of GMNPE formation; (C) Elemental analysis by energy-dispersive X-ray spectroscopy (EDS); (D) SEM observation of MNP, GMNP, and GMNPE (scale bars = 1 μm); (E) Particle size distribution of GMNPE at key steps of formation; (F) Changes in Zeta potential of GMNPE before and after stepwise modification; (G) Magnetic hysteresis loop of GMNPE; (H) Confocal microscopy imaging of anti-CD63 on GMNPE surface (bar = 25 μm); (I) Measurement of human serum albumin (HSA) adsorption on GMNPE and GMNPN nanoparticles after incubation at 37 °C for 3 days, FITC-labeled HSA, fluorescence spectroscopy used to measure the adsorption amount of HSA; (J) TGA analysis of antibody content in GMNPE. All experiments were repeated three times. * indicates difference between two groups with p < 0.05, ** indicates difference with p < 0.01, *** indicates difference with p < 0.001

