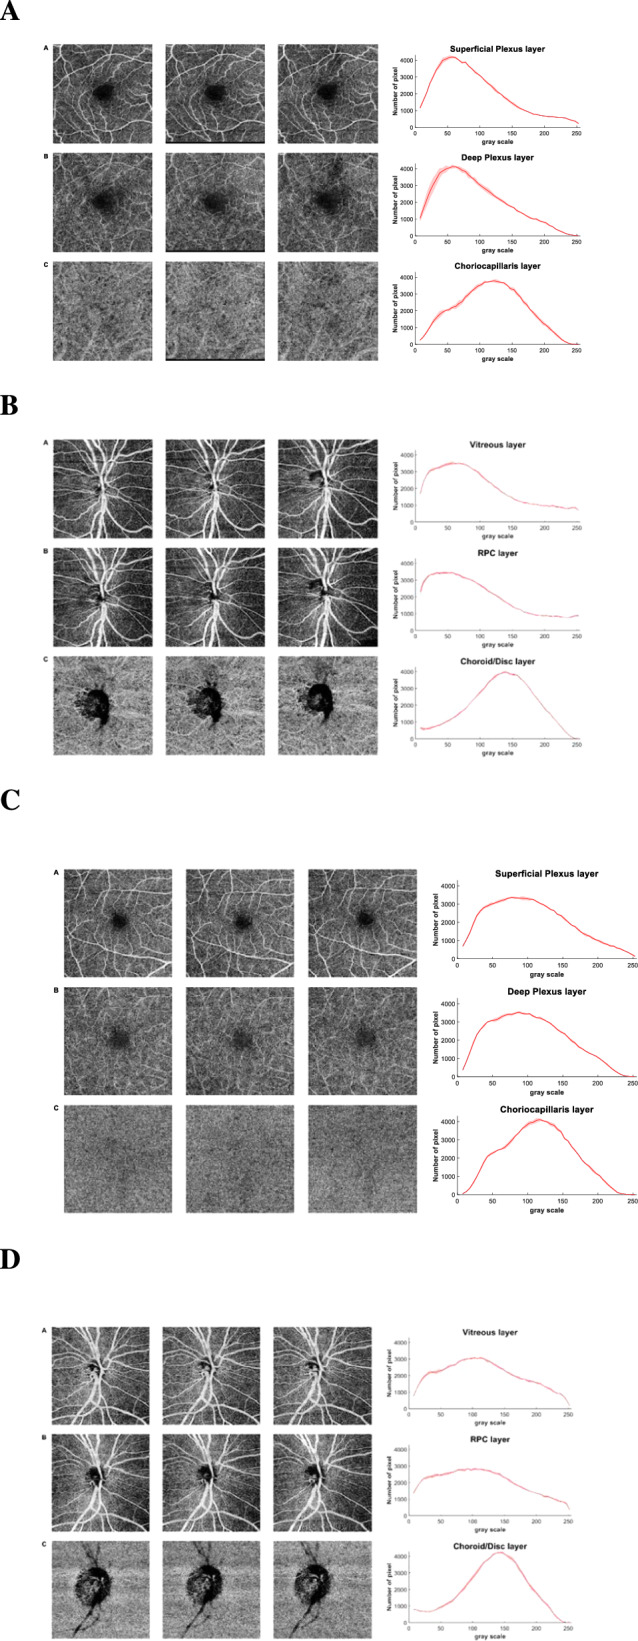
Fig. 1. Three Swept-Source (Topcon, DRI OCT Triton) OCT-A scan images.

A for a representative glaucoma patient in the macular assessment: A Superficial Plexus, B Deep Plexus and C Choriocapillaris layers. On the right, the function distribution with mean and standard deviation of the three scans for each bin. B for a representative glaucoma patient in the assessment of the optic disc: A Vitreous, B RPC and C Choroid/disc layers. On the right, the function distribution with mean and standard deviation of the three scans for each bin. C for a representative control subject in the macular assessment: A Superficial Plexus, B Deep Plexus and C Choriocapillaris layers. On the right, the function distribution with mean and standard deviation of the three scans for each bin. D for a representative control subject in the assessment of the optic disc: A Vitreous, B RPC and C Choroid/disc layers. On the right, the function distribution with mean and standard deviation of the three scans for each bin.
