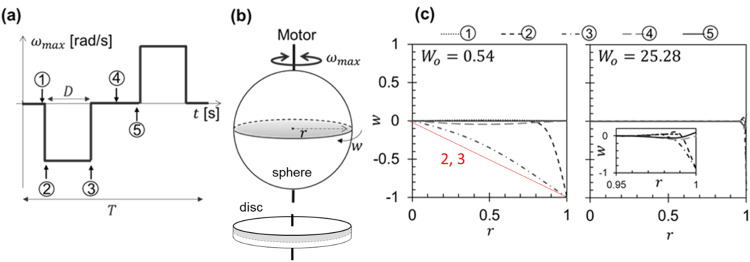
Fig. 6. Differences in velocity profiles between a 3D model eye—a sphere—and the ‘eye on a chip’ geometry of Chan et al. [29].
The saccadic motion is modelled as a square wave shown in (a), with rotational velocity cycling between , duration D and latency time 3D so that T = 4D. b shows the geometries: the equatorial plane is shaded. The velocity profiles in (c) show the scaled rotational velocity (local value divided by the maximum velocity reached at the wall) at different radial positions. Black loci show the velocity profiles for 0.5 Pa s SO (Womersley number, Wo = 0.54) and aqueous, Wo = 25.3, at time points indicated in (a), for a saccade displacement of 5.4° and = 200 °s−1. Low Wo indicates that viscous effects determine the time response. The red locus shows the velocity profile for solid body rotation, which Mulcahy et al. [30] observed in the ‘eye-on-a-chip’ geometry of [29]. The two geometries exhibit significantly difference histories. Based on [21], reproduced with permission.

