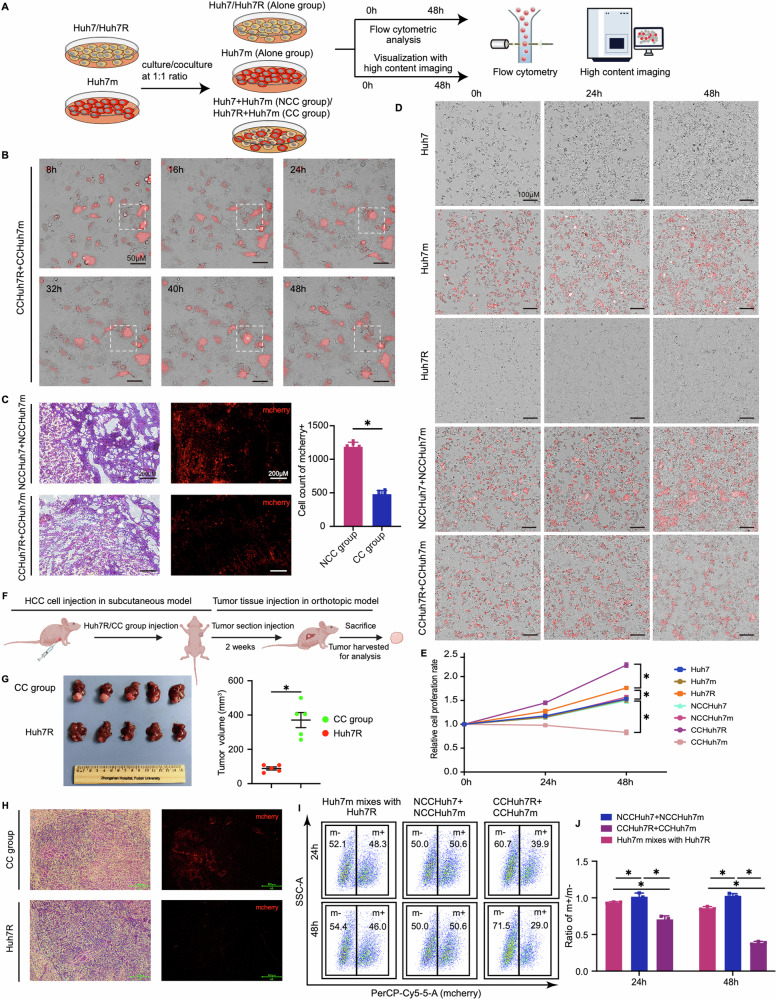
Fig. 1. Cell competition drives the dominant growth of lenvatinib-resistant cells in HCC.
A Schematic workflow of our experimental strategy. Huh7 or Huh7R was cocultured with Huh7m at 1:1 ratio or cultured alone respectively. Cells were cultured for 48 h after cell attachment and then performed by high content imaging analysis and flow cytometry analysis. B High content imaging of cell growth over a time course of coculture after cell attachment in CC group (CCHuh7R+CCHuh7m) using 20X objective lens (Details see Video 5). C (Left) Representative H&E stain and fluorescence imaging of cells in NCC group-and CC group-mice. (Right) Mcherry positive cells in NCC group and CC group were counted with ImageJ. N = 5. D High content imaging of cell growth at 0 h, 24 h, 48 h after cell attachment in Alone group (Huh7, Huh7m, Huh7R), NCC group (NCCHuh7+NCCHuh7m) and CC group (CCHuh7R+CCHuh7m) using 10X objective lens (Details see Video 6–10). E Quantitative statistics of cell proliferation rate in (D). F, G Schematic workflow (F), tumor photos and statistic analysis of tumor volume (G) in our HCC orthotopic model. N = 5. H (Left) Representative H&E stain and fluorescence imaging of cells in Huh7R group-and CC group-mice. (Right) Mcherry positive cells in CC group were counted with ImageJ. N = 5. I Flow cytometry analysis of cell proportion in NCC group, CC group and single Huh7m mixed with single Huh7R at 24 h and 48 h after cell attachment. mcherry+ (m+): Huh7m, NCCHuh7m, CCHuh7m; mcherry- (m-): Huh7R, NCCHuh7, CCHuh7R. J Quantitative statiststics of ratio (m+/m-) in (F). Three independent experiments were conducted, and the values are represented by means ± SEM using t-test (C, G) or two-way ANOVA with Tukey’s multiple comparisons test (E, J). *p < 0.05, ns non-statistically significant. See also Figs. S1 and S2.

