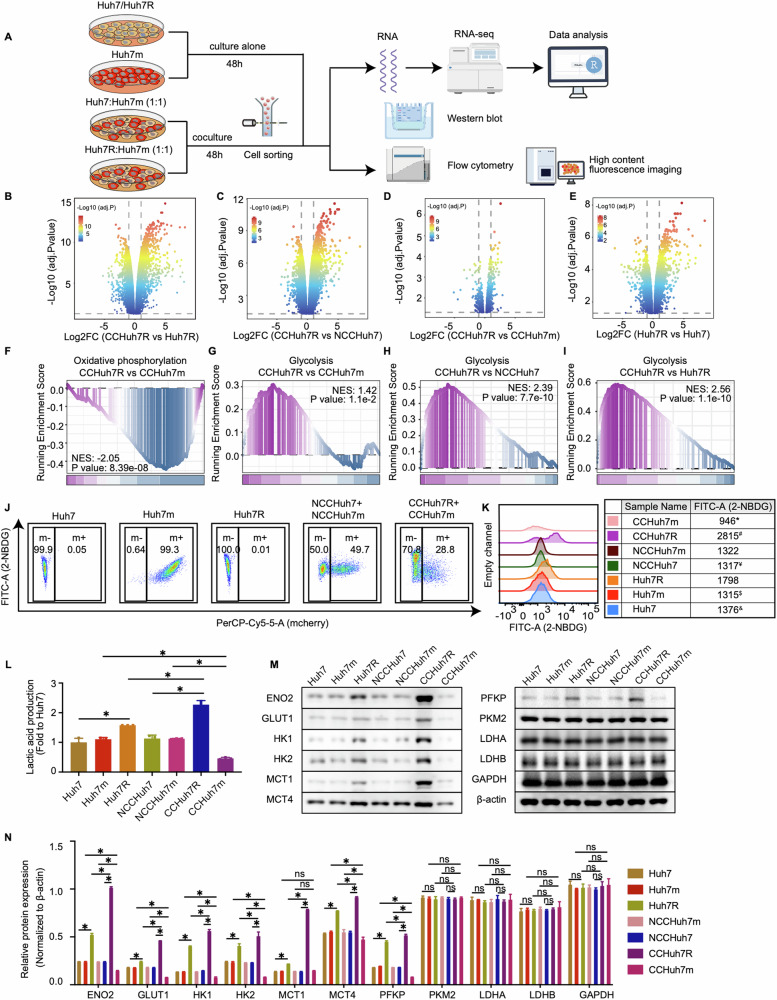
Fig. 2. Lenvatinib-resistant cells display upregulated glycolytic metabolism in cell competition at transcriptomic level.
A Schematic workflow of our experimental strategy by Figdraw. Huh7, Huh7m and Huh7R cultured alone; Huh7 or Huh7R cocultured with Huh7m at 1:1 ratio respectively. Cells were cultured for 48 h after cell attachment and then coculture groups were separated using flow cytometry sorting for RNA-seq, Western blot and other purposes. B Volcano plot showing differentially expressed genes in CCHuh7R vs CCHuh7R group. C As in (B) but in CCHuh7R vs NCCHuh7 group. D As in (B) but in CCHuh7R vs CCHuh7m group. E As in (B) but in Huh7R vs Huh7 group. F GSEA analysis of oxidative phosphorylation enrichment in CCHuh7R vs CCHuh7m group. G GSEA analysis of glycolysis enrichment in CCHuh7R vs CCHuh7m group. H As in (G) but in CCHuh7R vs NCCHuh7 group. I As in (G) but in CCHuh7R vs Huh7R group. J Flow cytometry analysis of 2-NBDG-FITC-A and cell proportion at 48 h after cell attachment in Alone group, NCC group and CC group. K Mountain map of 2-NBDG-FITC-A in (J). * CCHuh7m vs NCCHuh7m (p < 0.05); $ CCHuh7m vs Huh7m (p < 0.05); ¥ CCHuh7R vs NCCHuh7 (p < 0.05); # CCHuh7R vs Huh7R (p < 0.05); & Huh7R vs Huh7 (p < 0.05). L Cellular lactic acid production levels at 48 h after cell attachment in Alone group, NCC group and CC group by flow cytometry cell sorting. M Protein levels of ENO2, GLUT1, HK1, HK2, MCT1, MCT4, PFKP, PKM2, LDHA, LDHB and GAPDH at 48 h after cell attachment in Alone group, NCC group and CC group detected by western blot. N Quantitative statistics of protein levels in (M). Three independent experiments were conducted, and the values are represented by means ± SEM using two-way ANOVA with Tukey’s multiple comparisons test. *p < 0.05, #p < 0.05, $p < 0.05, ¥p < 0.05, &p < 0.05, ns non-statistically significant. See also Fig. S3.

