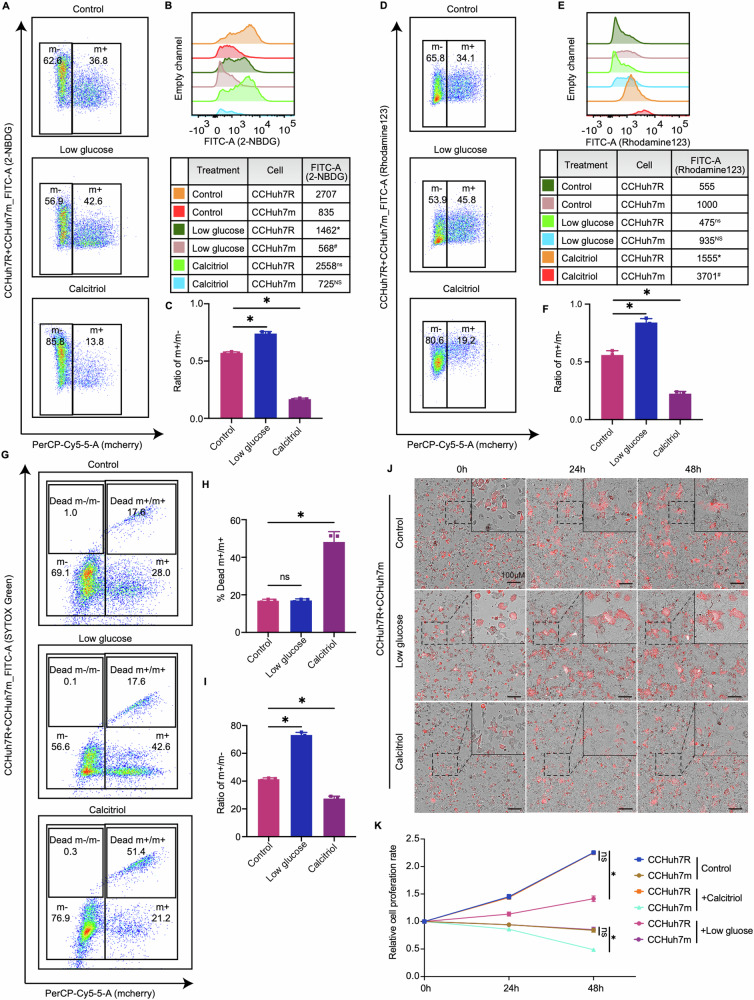
Fig. 3. Enhanced glycolysis supports the winner status of lenvatinib-resistant cells.
A Flow cytometry analysis of 2-NBDG-FITC-A and cell proportion at 48 h after cell attachment in CC group with low glucose or Calcitriol treatment. B Quantitative statistics of 2-NBDG-FITC-A intensity in (A). * CCHuh7R (Low glucose) vs CCHuh7R (Control) (p < 0.05); # CCHuh7m (Low glucose) vs CCHuh7m (Control) (p < 0.05); ns CCHuh7R (Calcitriol) vs CCHuh7R (Control) (p > 0.05); NS CCHuh7m (Calcitriol) vs CCHuh7m (Control) (p > 0.05). C Quantitative statistics of ratio of m + /m- in (A). D Flow cytometry analysis of mitochondrial membrane potential (Rhodamine123-FITC-A) and cell proportion at 48 h after cell attachment in CC group with low glucose or Calcitriol treatment. E Quantitative statistics of 2-NBDG-FITC-A in (D). ns CCHuh7R (Low glucose) vs CCHuh7R (Control) (p > 0.05); NS CCHuh7m (Low glucose) vs CCHuh7m (Control) (p > 0.05); * CCHuh7R (Calcitriol) vs CCHuh7R (Control) (p < 0.05); # CCHuh7m (Calcitriol) vs CCHuh7m (Control) (p < 0.05). F Quantitative statistics of ratio of m + /m- in (D). G Flow cytometry analysis of cell death (SYTOX Green-FITC-A) and cell proportion at 48 h after cell attachment in CC group with low glucose or Calcitriol treatment. H Quantitative statistics of Dead m + /m+ ratio in (G). I Quantitative statistics of m + /m+ ratio in (G). J High content imaging of cell growth at 0, 24 h, 48 h after cell attachment in CC group with low glucose or Calcitriol treatment using 10X objective lens. K Quantitative statistics of cell number in (J) (Details see Video 11–13). Three independent experiments were conducted, and the values are represented by means ± SEM using two-way ANOVA with Tukey’s multiple comparisons test (B, E and K) or Ordinary one-way ANOVA with Sidak’s multiple comparisons test (C, F, H and I). *p < 0.05, #p < 0.05, ns/NS non-statistically significant.

