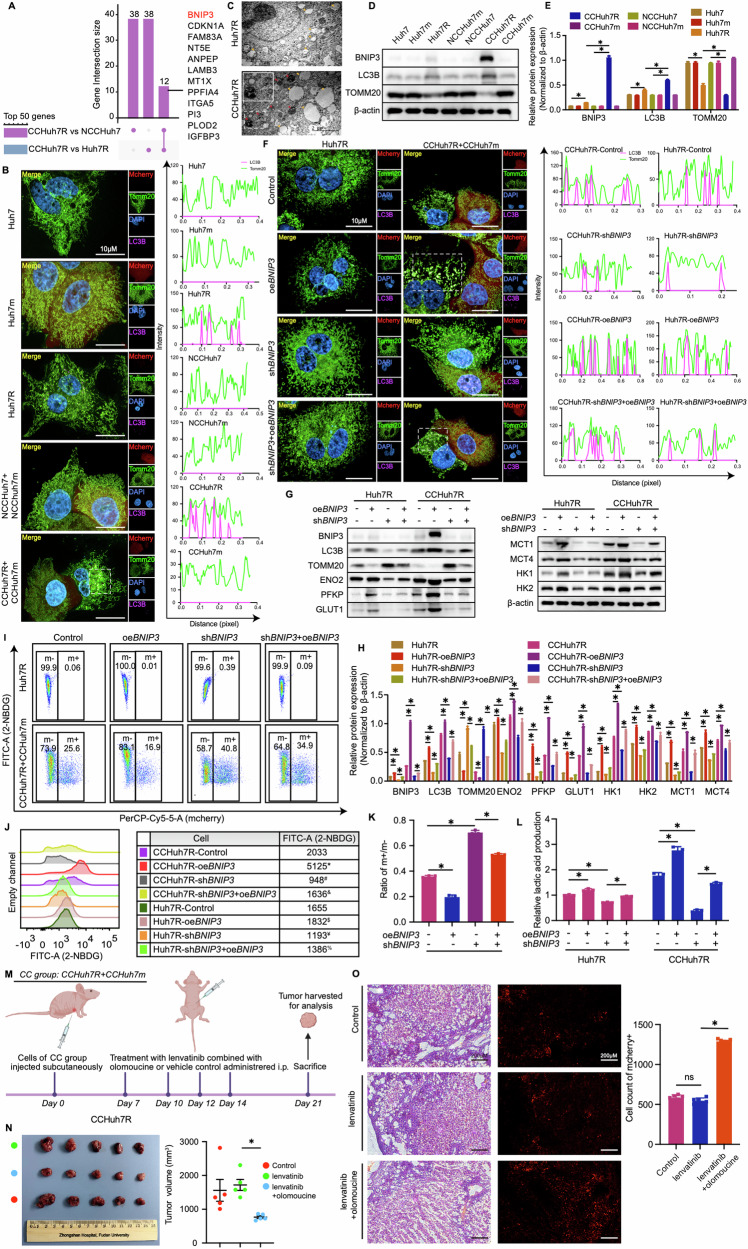
Fig. 4. Enhanced glycolytic flux of lenvatinib-resistant cells (winner) requires BNIP3-mediated mitophagy.
A UpSet plot showing Top 50 DEGs’ overlapping genes in CCHuh7R vs Huh7R group and CCHuh7R vs NCCHuh7 group. B (Left) High content immunofluorescence imaging of colocalization of autophagosomes (Cy5.5-LC3: purple) and mitochondria (TOMM20: green) at 48 h after cell attachment in Alone group, NCC group and CC group using 63X water immersion objective lens. (Right) Quantification of colocalization between LC3 (purple peak) and TOMM20 (green peak) in the above groups. Purple/green peak height represents fluorescence intensity of LC3B/TOMM20; overlapping peaks indicate colocalization numbers between LC3B and Tomm20. C Transmission electron microscope imaging of Huh7R and CCHuh7R, the arrow (orange) indicates mitochondria of cell, the arrow (red) represents mitophagy activity in cell. The enlargement picture of the dashed boxes in CCHuh7R shows the details of specific mitophagy activity. D Protein levels of LC3B, TOMM20 and BNIP3 at 48 h after cell attachment in Alone group, NCC group and CC group detected by western blot. E Quantitative statistics of protein levels in (C). F (Left) High content immunofluorescence imaging of colocalization of autophagosomes (Cy5.5-LC3: purple) and mitochondria (TOMM20: green) at 48 h after cell attachment in Huh7R (Alone group) /CCHuh7R (CC group) transfected with shRNA against BNIP3 (shBNIP3), BNIP3 overexpression plasmid (oeBNIP3) or oeBNIP3+shBNIP3 using 63X water immersion objective lens. (Right) Quantification of colocalization between LC3 (purple peak) and TOMM20 (green peak) in the above groups. Purple/green peak height represents fluorescence intensity of LC3B/TOMM20; overlapping peaks indicate colocalization numbers between LC3B and Tomm20. G Protein levels of LC3B, TOMM20, BNIP3, ENO2, GLUT1, HK1, HK2, MCT1, MCT4 and PFKP at 48 h after cell attachment in Huh7R (Alone group) /CCHuh7R (CC group) transfected with shBNIP3, oeBNIP3 or shBNIP3+oeBNIP3 detected by western blot. H Quantitative statistics of protein levels in (H). I Flow cytometry analysis of 2-NBDG-FITC-A and cell proportion at 48 h after cell attachment in Huh7R (Alone group) /CCHuh7R (CC group) transfected with shBNIP3, oeBNIP3 or shBNIP3+oeBNIP3. J Mountain map of 2-NBDG-FITC-A in (J). * CCHuh7R-oeBNIP3 vs CCHuh7R-Control (p < 0.05); # CCHuh7R-shBNIP3 vs CCHuh7R-Control (p < 0.05); & CCHuh7R-shBNIP3+oeBNIP3 vs CCHuh7R-shBNIP3 (p < 0.05); $ Huh7R-oeBNIP3 vs Huh7R-Control (p < 0.05); ¥ Huh7R-shBNIP3 vs Huh7R-Control (p < 0.05); % Huh7R-shBNIP3+oeBNIP3 vs Huh7R-shBNIP3 (p < 0.05). K Quantitative statistics of ratio m + /m- in (J). L Cellular lactic acid production levels at 48 h after cell attachment in Huh7R (Alone group) /CCHuh7R (CC group) transfected with shBNIP3, oeBNIP3 or shBNIP3+oeBNIP3 by flow cytometry cell sorting. (M-N) Schematic workflow (M), tumor photos and statistic analysis of tumor volume (N) in our HCC subcutaneous model under lenvatinib treatment with or without olomouine. N = 5. O (Left) Representative H&E stain and fluorescence imaging of cells in CC group-mice with or without lenvatinib or lenvatinib+olomouine. (Right) Mcherry positive cells in corrresponding groups were counted with Image (J). N = 5. Three independent experiments were conducted, and the values are represented by means ± SEM using two-way ANOVA with multiple comparisons test (E, H, L, J and M) or Ordinary one-way ANOVA with Sidak’s multiple comparisons test (K, N, O). *p < 0.05, #p < 0.05, $p < 0.05, ¥p < 0.05, &p < 0.05, %p < 0.05, ns non-statistically significant. See also Figs. S4 and S5.

