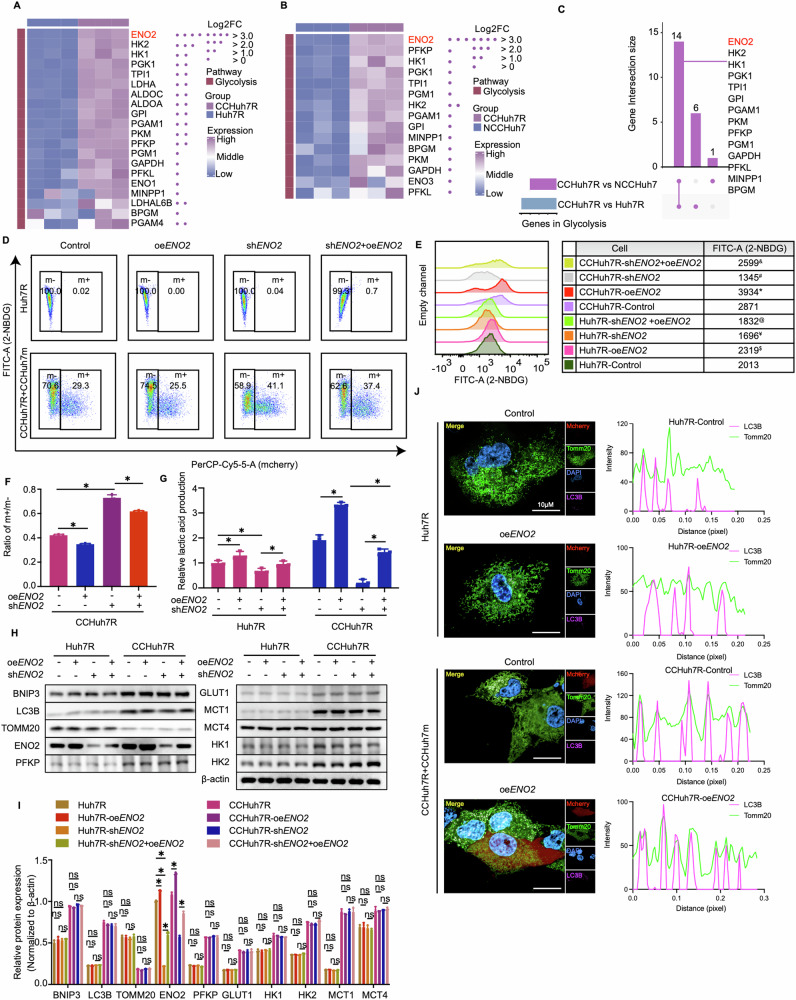
Fig. 5. The effect of glycolysis of winner is ENO2 dependent.
A Heatmap exhibiting expression levels of glycolysis-related genes between CCHuh7R and Huh7R. B As in (A) but between CCHuh7R and NCCHuh7. C UpSet plot displaying overlapping glycolysis-related genes based on (A) and (B). D Flow cytometry analysis of 2-NBDG-FITC-A and cell proportion at 48 h after cell attachment in Huh7R (Alone group) /CCHuh7R (CC group) transfected with shRNA against ENO2 (shENO2), ENO2 overexpression plasmid (oeENO2) or oeENO2+shENO2. E Mountain map of 2-NBDG-FITC-A in (D). * CCHuh7R-oeENO2 vs CCHuh7R-Control (p < 0.05); # CCHuh7R-shENO2 vs CCHuh7R-Control (p < 0.05); & CCHuh7R-shENO2+oeENO2 vs CCHuh7R-shENO2 (p < 0.05); $ Huh7R-oeENO2 vs Huh7R-Control (p < 0.05); ¥ Huh7R-shENO2 vs Huh7R-Control (p < 0.05); % Huh7R-shENO2+oeENO2 vs Huh7R-shENO2 (p < 0.05). F Quantitative statistics of ratio m + /m- in (D). G Cellular lactic acid production levels at 48 h after cell attachment in Huh7R (Alone group) /CCHuh7R (CC group) transfected with shENO2, oeENO2 or shENO2+oeENO2 by flow cytometry cell sorting. H Protein levels of LC3B, TOMM20, BNIP3, ENO2, GLUT1, HK1, HK2, MCT1, MCT4 and PFKP at 48 h after cell attachment in Huh7R (Alone group) /CCHuh7R (CC group) transfected with shENO2, oeENO2 or shENO2+oeENO2 detected by western blot. I Quantitative statistics of protein levels in (H). J (Left) High content immunofluorescence imaging of colocalization of autophagosomes (Cy5.5-LC3: purple) and mitochondria (TOMM20: green) at 48 h after cell attachment in Huh7R (Alone group) /CCHuh7R (CC group) transfected with shENO2, oeENO2 or shENO2+oeENO2 using 63X water immersion objective lens. (Right) Quantification of colocalization between LC3 (purple peak) and TOMM20 (green peak) in the above groups. Purple/green peak height represents fluorescence intensity of LC3B/TOMM20; overlapping peaks indicate colocalization numbers between LC3B and Tomm20. Three independent experiments were conducted, and the values are represented by means ± SEM using a two-way ANOVA with Tukey’s multiple comparisons test (E, G and I) or Ordinary one-way ANOVA with Sidak’s multiple comparisons test (F). *p < 0.05, #p < 0.05, $p < 0.05, ¥p < 0.05, &p < 0.05, %p < 0.05, ns = non-statistically significant. See also Fig. S5.

