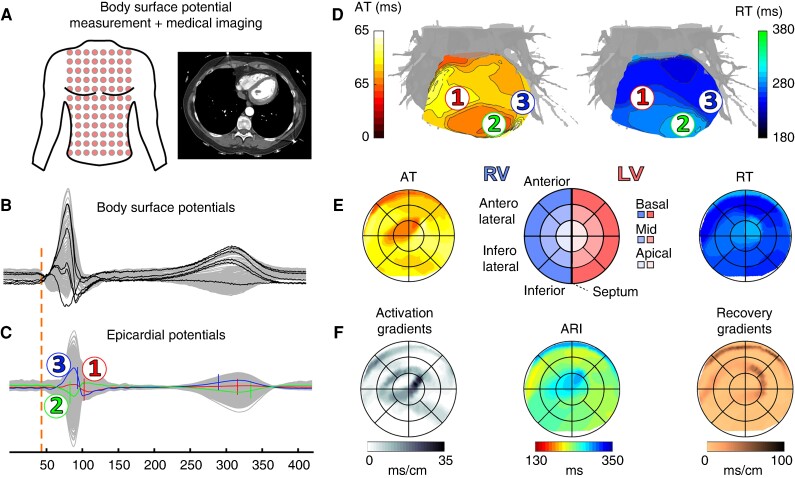
Figure 1.
ECGI study procedure.6 (A) Body surface potential measurement and cardiothoracic imaging (CT or MRI) to visualize electrode positions and heart geometry. (B) Recorded body surface potentials before inverse reconstruction. (C) Epicardial reconstructed potentials for each virtual node on the ventricular surface. Numbers 1, 2 and 3 indicate examples of electrograms, sampled from indicated locations in panel D. (D) By determination of AT (steepest downslope of local QRS complex in C) and RT (steepest upslope of local T wave9 in C), activation and recovery isochronal maps were calculated. (E) Epicardial bullseye projection of isochronal AT and RT maps, with anatomical reference shown in the middle. (F) Bullseye projection of activation gradients, ARI, and recovery gradients, all derived from (D). ARI, activation–recovery interval; AT, activation time; LV, left ventricle; RT, recovery time; RV, right ventricle.

