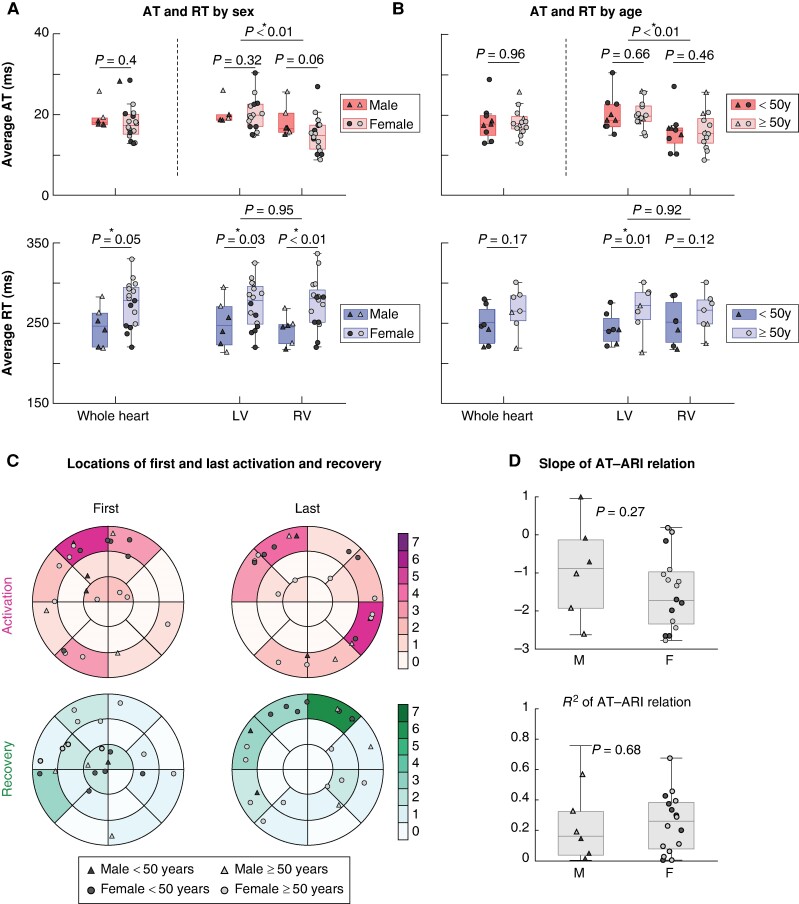
Figure 3.
Overview of control results. (A) Average AT and RT for males and females. The top horizontal bar indicates P-value between LV and RV. Second-level horizontal bars indicate P-values between males and females. Asterisks above P-values (*) indicate significant differences. Triangles indicate males, circles indicate females, filled symbols indicate subjects <50 years, and open symbols indicate subjects ≥50 years. (B) Average AT and RT for subjects <50 and ≥50 years. (For RT, only seven subjects were included for each group, to ensure similar RR intervals.) (C) Locations of first and last areas of activation and recovery. (D) Slope and coefficient of determination of AT–ARI relation (see Results). ARI, activation–recovery interval; AT, activation time; F, female; LV, left ventricle; M, male; RT, recovery time; RV, right ventricle.

