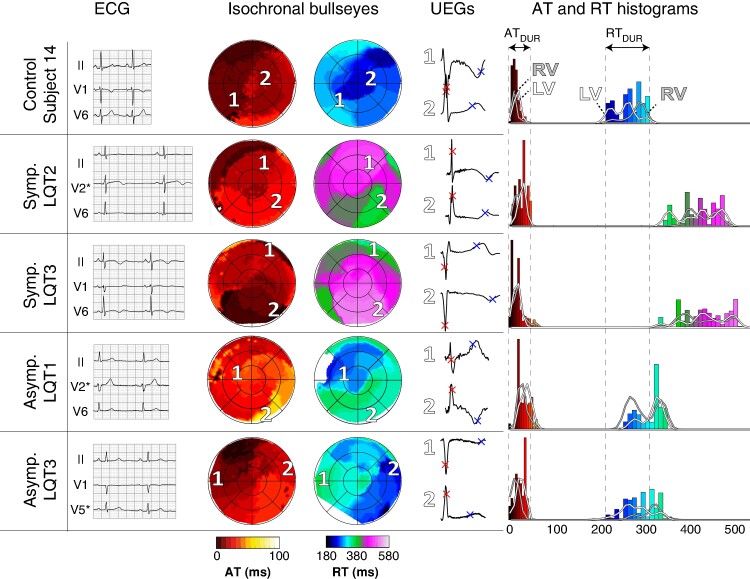
Figure 7.
Comparison of activation and recovery patterns of five subjects in sinus rhythm: a control subject (top), two clinically overt LQTS patients with history of ventricular tachyarrhythmias (‘Symp. LQT2’ and ‘Symp. LQT3’) and two clinically occults without such history (‘Asymp. LQT1’ and ‘Asymp. LQT3’). Body surface ECGs, isochronal bullseyes with selected UEGs (indicated by numbers 1 and 2), and AT and RT histograms are shown from left to right. (Dys)synchrony in activation and recovery between LV and RV, as visible in isochronal bullseyes, is also reflected in the histograms. AT, activation time; ATDUR, duration of activation; LQT, long-QT; LV, left ventricle; RT, recovery time; RTDUR, duration of recovery; RV, right ventricle; UEGs, unipolar electrograms.

