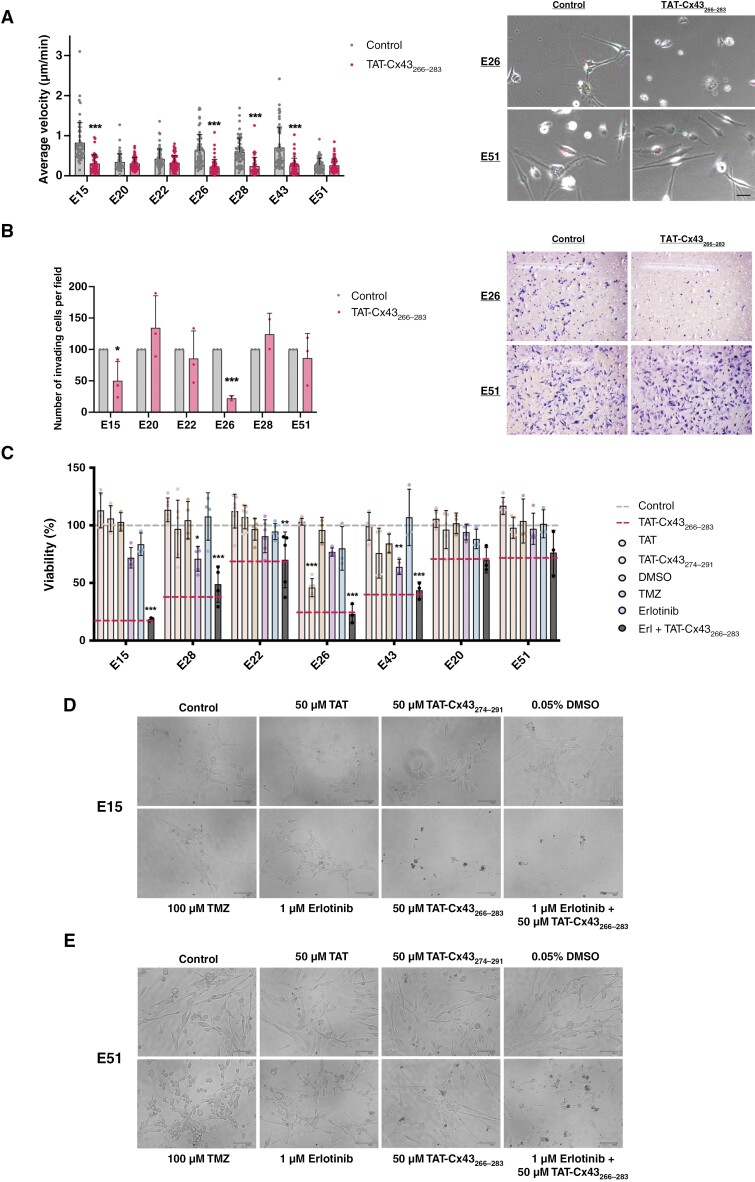
Figure 2.
Effect of TAT-Cx43266–283 in cell migration and invasion, and comparison of its effect on cell viability vs temozolomide and erlotinib in GBM patient-derived GSCs. A set of GBM patient-derived GSCs and healthy human NSCs were treated with 50 µM TAT, 50 µM TAT-Cx43274–291 (2 cell-penetrating peptides used as additional controls), 50 µM TAT-Cx43266–283, 100 µM temozolomide, 1 µM erlotinib, 0.05% DMSO (v/v) (vehicle for erlotinib), and the combination of 1 µM erlotinib plus 50 µM TAT-Cx43266–283. (A) Quantification of the average velocity of EGFR altered and unaltered patient-derived GSCs after treatment with 50 µM TAT-Cx43266–283 and representative frames from the time-lapse microscopy movies of EGFR altered (E26) and EGFR unaltered (E51) patient-derived GSCs (see SupplementaryMovies). Results are represented as mean ± SEM of 2 independent experiments in which approximately 50 cells per cell line and experimental group were tracked, ANOVA: ***P value < .001 vs control. Scale bar: 50 µm. (B) Quantification of the number of Matrigel invading GSCs per frame after treatment with 50 µM TAT-Cx43266–283 and representative frames of EGFR altered (E26) and EGFR unaltered (E51) patient-derived GSCs. Results are expressed as the percentage of the control (mean ± SEM of 3 independent experiments except for the lines E26 and E28, in which 2 independent experiments were performed, ANOVA: *P value < .05, ***P value < .001 vs control. (C) Alamar blue viability assay after 6 days of treatment administered at days 0 and 3. Results are expressed as the percentage of the control (upper dashed line) (mean ± SEM of at least 3 independent experiments, ANOVA: *P value < .05, **P value < .01, ***P value < .001 vs control. (D and E) Representative phase-contrast images of 2 patient-derived GSCs with (E15) (D) and without (E51) (E) EGFR alterations treated as described above. Scale bar: 100 µm.

