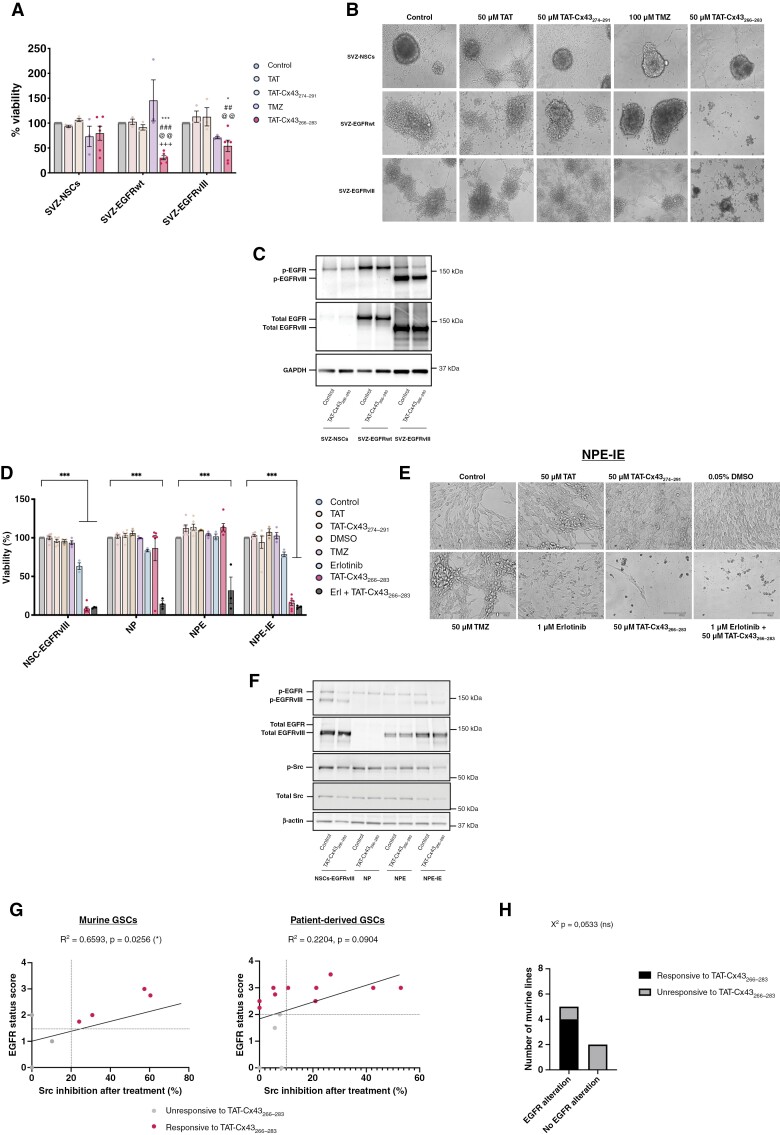
Figure 3.
The effect of TAT-Cx43266–283 depends on EGFR alterations. A set of murine SVZ NSCs with EGFR alterations (SVZ-EGFRwt and SVZ-EGFRvIII) and a set of murine SVZ NSCs with EGFRvIII mutation (NSC-EGFRvIII), with Nf1/PTEN deletion (NP) or with a combination of Nf1/PTEN deletion and EGFRvIII mutation (NPE, and their immune evasive version, NPE-IE) and their non-modified counterparts (SVZ-NSCs) were treated with 50 µM TAT, 50 µM TAT-Cx43274–291 (2 cell-penetrating peptides used as additional controls), 50 µM TAT-Cx43266–283, 100 µM temozolomide, 1 µM erlotinib, 0.05% DMSO (v/v) (vehicle for erlotinib) and the combination of 1 µM erlotinib plus 50 µM TAT-Cx43266–283. (A) Alamar blue viability assay of SVZ NSCs with EGFR alterations and healthy NSCs after 6 days of treatment administered at days 0 and 3. Results are expressed as the percentage of the control (mean ± SEM of at least 3 independent experiments, ANOVA: *P < .05, ***P < .001 vs control; ##P < .01, ###P < .001 vs TAT; @@P < .01 vs TAT-Cx43274-291; +++ P < .001 vs temozolomide). (B) Phase-contrast images of murine NSCs with and without EGFR alterations treated as described previously. Scale bar: 100 µm. (C) WB analysis of EGFR and EGFRvIII levels and activity (p-EGFR Y1068 and p-EGFRvIII Y1068) after 24 h treatment. GAPDH was used as a loading control. (D) Alamar blue viability assay of SVZ NSCs with EGFR and additional GBM-driver alterations after 6 days of treatment administered at days 0 and 3. Results are expressed as the percentage of the control (mean ± SEM of at least 3 independent experiments, ANOVA: ***P value < .001). (E) Phase-contrast images of murine SVZ NSCs with GBM-driver alterations treated as described in (A). Scale bar: 100 µm. (F) WB analysis of EGFR, EGFRvIII, and Src levels and activity (p-EGFR Y1068, p-EGFRvIII Y1068, and p-Src Y416) after 24 h treatment. β-actin was used as a loading control. (G) Correlation graph depicting the relationship between GSC EGFR status and Src inhibition after treatment with TAT-Cx43266–283 in murine and patient-derived GSCs. (H) Contingency table graph showing the magnitude of TAT-Cx43266–283 response and EGFR status of all the murine NSCs and GSCs. χ2 test was used for statistical analysis.

