Figure 2.

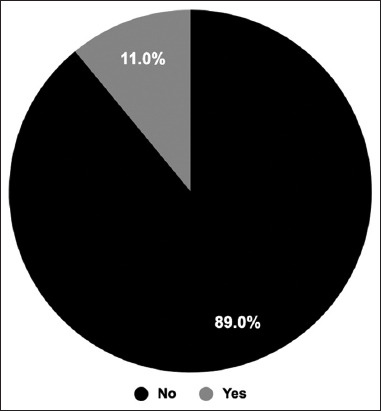
Additional side effects. The participants were asked whether they had any additional side effects. The pie chart shows the percentage of the participants who said yes, they had or no they had not

Additional side effects. The participants were asked whether they had any additional side effects. The pie chart shows the percentage of the participants who said yes, they had or no they had not