Figure 3.

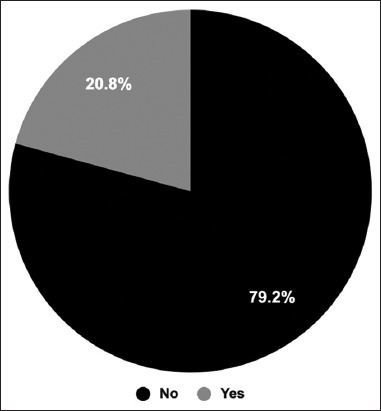
Persistent side effects post-Coronavirus disease 2019 vaccination. The pie chart shows the percentages of participants who had persistent side effects compared to the percentage of participants who did not have persistent side effects

Persistent side effects post-Coronavirus disease 2019 vaccination. The pie chart shows the percentages of participants who had persistent side effects compared to the percentage of participants who did not have persistent side effects