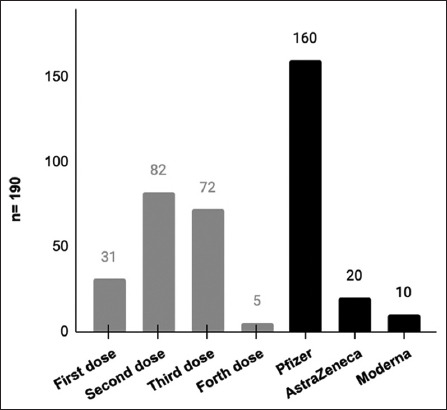
Figure 5.

The disease appeared after any dose and which type of vaccine. Participants were asked to determine after which dose, they were diagnosed with the disease, as well as after any type of vaccine. The bar chart shows the comparison between the number of participants, who were diagnosed with diseases (n = 190) after each dose and the type of vaccine
