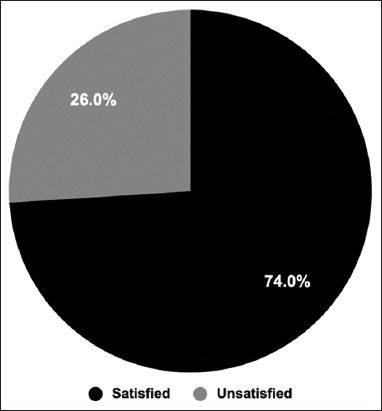
Figure 6.

Participants’ satisfaction with their health status. The participants were asked whether they were satisfied with their health status post-Coronavirus disease 2019 vaccination. The pie chart shows the percentage of satisfied participants compared to unsatisfied ones
