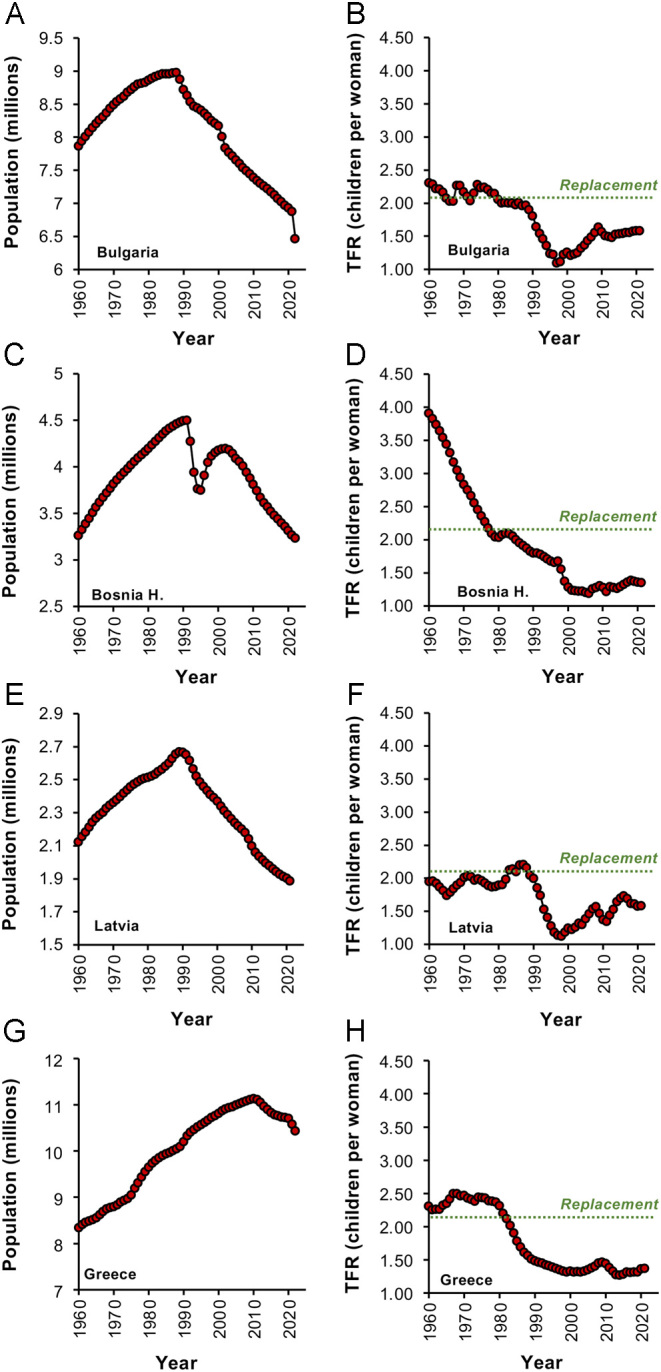
Figure 3.

Changes in population numbers in some of the most vulnerable countries in the world. Left hand panels show the rise and fall of population numbers for each country since 1960 while the right-hand panels show the corresponding TFR values, which have been consistently below replacement level. (A) and (B), Bulgaria; (C) and (D) Bosnia Herzegovina; (E) and (F) Latvia; (G) and (H) Greece. Source: World Bank Open data (https://data.worldbank.org/indicator/SP.DYN.TFRT.IN and https://data.worldbank.org/indicator/SP.POP.TOTL).

 This work is licensed under a